Ever wanted to understand Dynabowl Drafts better? Well, we’re here to make that much, much harder.
Here’s some basic “analysis” of the nine Dynabowl drafts to have taken place so far. The dataset will be available at the bottom of this article for you to download and do your own review. But you MUST read it all first. Standard rules – no downloading without reading.
A couple of reminders – in the first three drafts – 2015-2017 – we only had 7 rounds, before ramping things up to 12 in 2018. That’ll likely skew a few bits, but hey.
Let’s start things off with some simple counting. How many players of each position have we drafted each year?
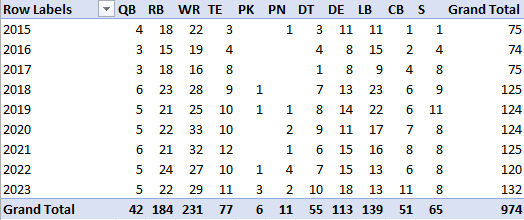
Would you look at that. And what do we take away from all that? I don’t know. Take away what you will. CBs are the least popular, though a big jump in 2023, reacting to the change in contract guarantees to prevent streaming, perhaps? The last couple of years have seen 5 special teamers taken after 7 were taken in total in the first 7 years, but more punters than kickers taken is, well, not interesting but mildly notable perhaps?
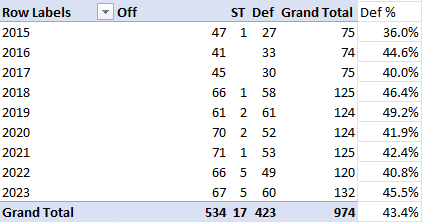
Excepting 2015, we’ve been pretty consistent in the percentage of defensive players taken, and 2023 seeing the second most taken in a draft ever. It’s still slightly more offense focused, but not by a huge margin.
Maybe it’s more interesting to look at who’s gone for what positions…
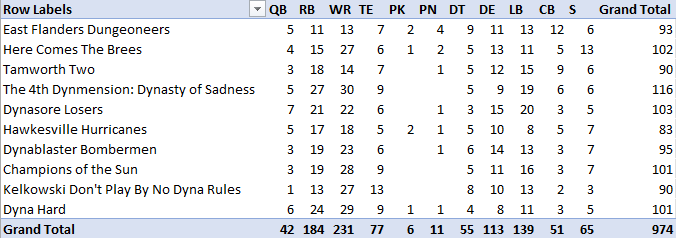
The Dungeoneers loves a punter.
The Sadness have taken more RBs and WRs than anyone else, but have also had at 13 more picks than every other team as well.
The Brees have taken nearly double the number of safeties than anyone else, which is pretty astonishing, and 20% of all the safeties ever taken, while the Dungeoneers have taken 23.5% of all CBs ever taken.
Just by position group, two teams have spent more than half their picks on defense…
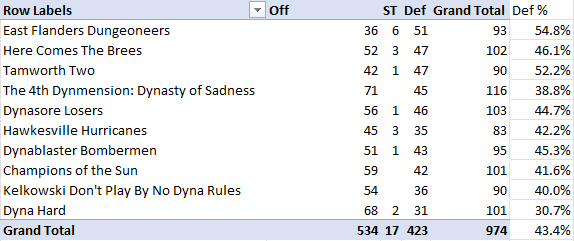
… while Dyna Hard just could not care less about defense.
In terms of rounds, where do the players get taken?
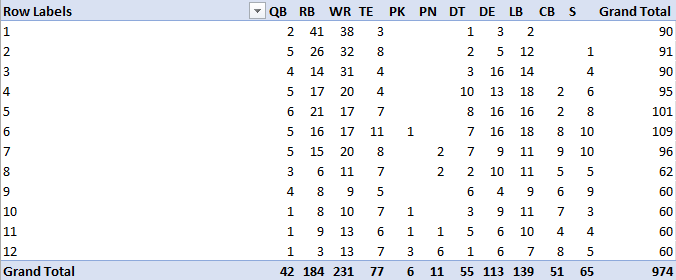
Perhaps unsurprisingly, it takes a while for defensive players to really get going in the league. Just 6.7% of first round picks go on that side of the ball, and it takes to round 3 to get close to the overall average – 41.1% vs an average of 43.4%.
Rounds 4, 6, and 8-10 all have more than 50% of their picks going on the defense.
Finally, what draft slot is the first player at each position taken?
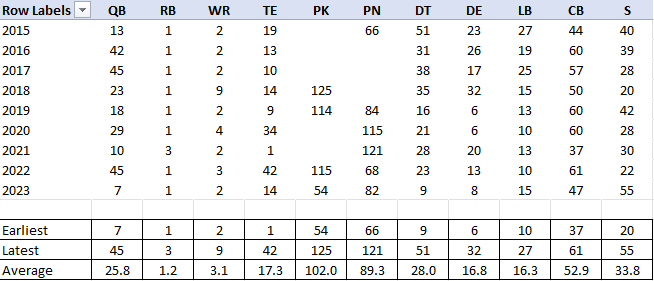
DT has slowly risen in the rankings, moving from 51, into the 30s fairly consistently, the teens and twenties and finally the first round in 2023. DE and LB have both shifted up a bit as well, with a clear change in mindset from 2019 onwards on the DE front.
RB has gone first every year bar 2021 – the Kyle Pitts year – while WR has been consistently high, with an exception in 2018 where, astonishingly, it took until pick 9 for Calvin Ridley to be selected. That year opened with 8 RBs – Barkley, Guice, Ronald Jones, Penny, Chubb, Michel, Freeman, and Kerryon Johnson. Two decent picks there, ahead of Ridley and DJ Moore roudning out the first.
Worth noting that in the last 4 drafts, the Sadness have been the first to take a TE – Trautman (2020, 34th), Pitts (2021, 1st), McBride (2022, 42nd), Kincaid (2023, 14th).
Anyway, here’s where you can download the data and do your own analysis. As ever, you’re welcome to send your ‘insights’ in and have them published on the site for us all to enjoy.