It’s the middle of the season, so what better time to look back at championships past and see if there’s anything remotely interesting from a statistical point of view. And failing that, find some boring things from a statistical point of view to share.
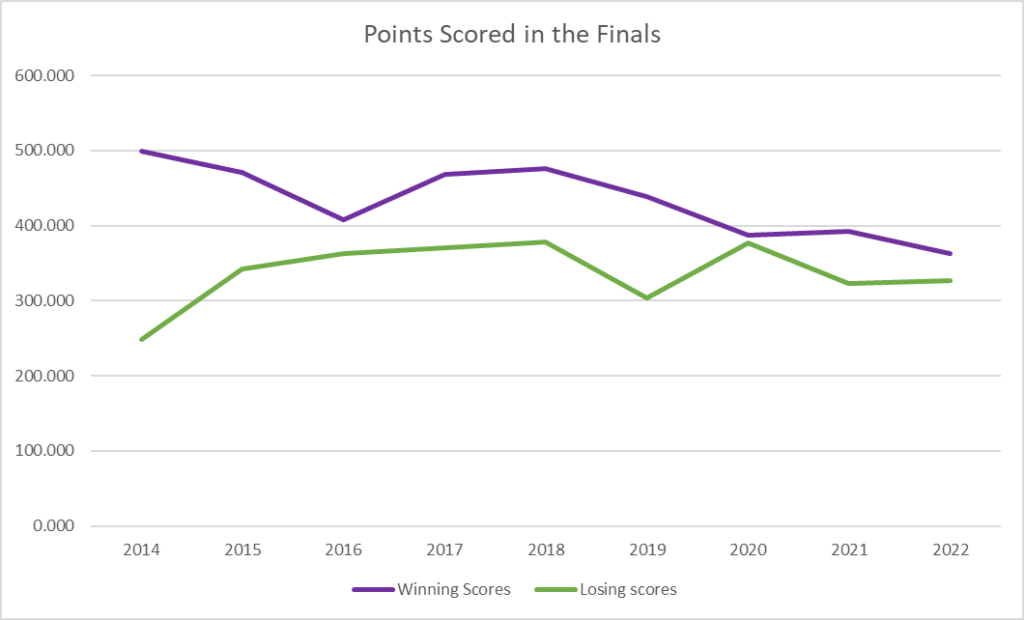
We’ve all seen the records, of course, so there’s no need to regurgitate the results. Instead, let’s look at different numbers. Like, do teams score more points in the final now?
Errr…. No…

Teams that win the final are scoring less, while teams that lose the final are scoring… incredibly consistently (if we ignore the Brees in 2014). It’s good news for excitement – there’s only been one comeback victory (Dyna Hard, 2017) but at least there are closer matches. The second legs of the last three finals – 2020-2022 – have all been won by the team that lost the first leg, after both legs were won by the same team in five of the first 6 finals.
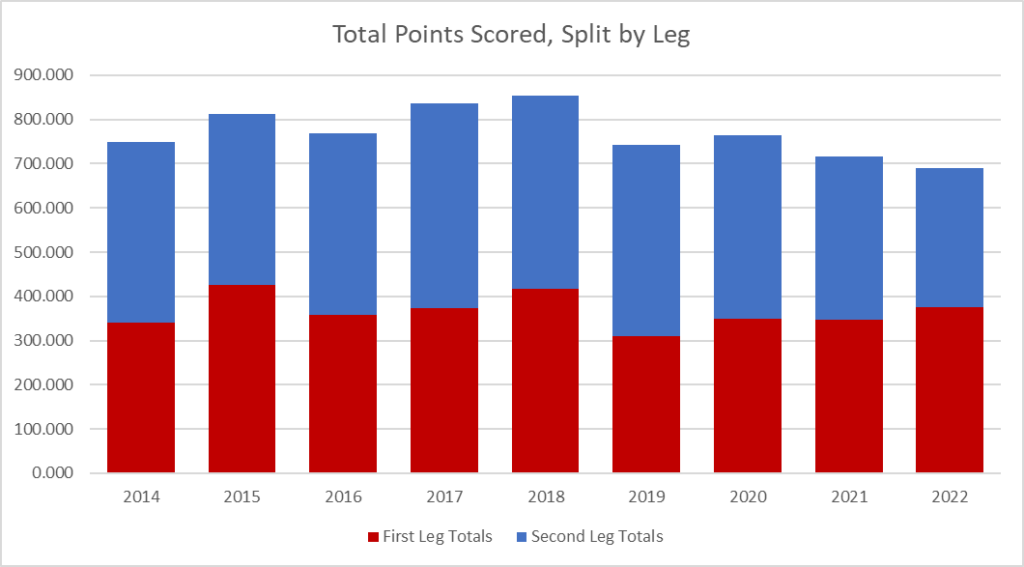
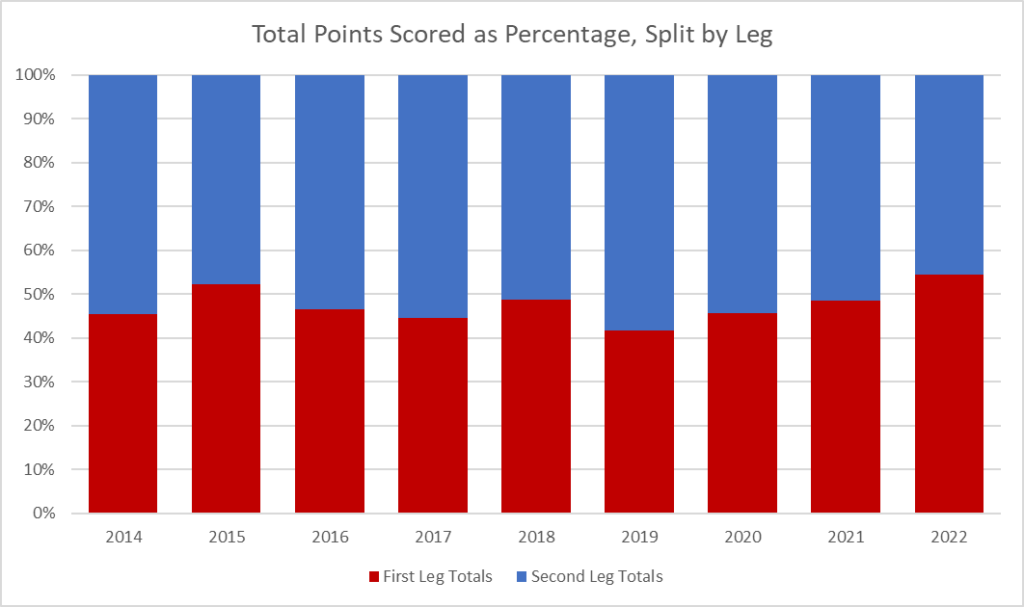
But how about the split of total points across the two legs?


Only two of the nine finals have had more points scored in the first leg than the second. Rather than getting used to each other and neutralising each others attacks, it seems that familiarity breeds explosive offense and an eye for the opponents defensive weaknesses. Or maybe that was a conclusion we could draw if these were actual teams actually facing each other, rather than random players unaware of the importance of their performance in the Dynabowl world.
We can also see, in the top chart, that total points rose to 2018 and have been falling since then. Someone who cares more would probably go back and check the scoring changes we put in place to see if they align.
I can be bothered to do one quick check though. There’s a ranked list of total points scored, per team, per season. Because there’s been an extra game since 2021, we can’t quite compare like for like, but for total points scored to the end of week 16, 9 of the top 20 team seasons have been after 2018, while 11 of the bottom 20 seasons have come in the same period.
Given there were five seasons in the ‘high scoring finals period’ (2014-2018) and only 4 since, this might indicate a slight drop in scoring overall. Especially as the 6 worst seasons were all between 2020 and 2022.
So there we have it – finals are more exciting (CLOSER GAMES) and less exciting (FEWER POINTS) than ever!
Seeding! Does it matter?
What I mean by that is, are the higher seeds more likely to win the title? Let’s take a look…

I’m kind of astonished that no one has looked at this before. The abject failure of the number 2 seed to do anything notable at any point is pretty crazy. It took until 2022 for the second seed to win a 2-game match-up (ie the final or 3rd place playoff). The first seed dominance of the past 4 years is also a surprise. In fact, the first seed has always won the 2-game match-up, and in 7 of those 9 years that has been against the number 2 seed.
The run of wins by number 3 seeds also seems like a bit of a surprise. However, in 2016, Kelkowski held the same record as the #1 seed Bombermen (and the #4 seed Hard), in 2017 Dyna Hard were a game behind the #1 seed Hurricanes (then Firebirds), but were league top scorers, 50 points ahead of the #1 seed, while in 2018 the number one seeds were the 13-0 Dyna Hard, who were destined to fail.
Just out of curiosity, I assigned 3 points for a win, 2 for runner-up, 1 for third and 0 for 4th. The number 1 seed gets 19 points, #2 gets 7, #3 17 and the fourth seed gets 11 points. That should really put things in perspective. Idle speculation and shit-stirring, but the top two seeds go to the winners of Peter and Tim. Guess what, 7 out of 9 #1 seeds have come from Tim, bookended by Peter (Losers in 2014, Brees in 2022).

Using the patented 3 for a win, 2 for runner-up, 1 for third scoring system, Tim clocks in with 33 points while Peter only racks up 21 across the nine years, but then with only two titles to show for it – both coming in years when the division managed to send 3 teams to the playoffs – that’s probably to be expected.
So back to the exam question – does seeding matter? Only in so much as the second seed was usually from Peter and they usually lost. What matters most is that the team come from Tim.
Double Hundreds
3 teams have scored at least 200 in both legs of the final, the Hurricanes (né Firebirds) in 2014, Champions in 2015 and the Dungeoneers in 2018. No teams have won the title without scoring 200 in at least one leg (though the Champions really pushed that in 2020, scoring 200.145 in the second leg), while only one losing team has managed to score 200 or more in a single leg of the final (the Tamworth Two in that same final against the Champions in 2020).
Regular Season Results Between Finalists
Every year, every team will play every other team at least once. Twice if they are in the same conference, once in the other conference, though since 2021 teams have had a second game against one team from the other conference.
The table below shows the match-ups in the final and the regular season record between the two teams.

Only once has the team winning the final not beaten their opponents at least once in the regular season. That came in 2019 when the Bombermen used the playoffs as a revenge tour. Having gone 11-2 in the regular season they beat Tamworth Two in the playoff semi-final before knocking off the Dungeoneers in the final – those were the only two teams to beat them during the regular season. Is this more impressive than Dyna Hard going 13-0 and then losing the playoff semi-final in 2018? Almost certainly.
What Can We Learn?
Want to win a title? If you make the playoffs, ideally be the first seed and, if not, be the third seed. Try not to be in Peter and make sure you beat your opponent at least once during the regular season, and score 200 in at least one game week.