Category: Stat Attacks

Championship Game Statistics

It’s the middle of the season, so what better time to look back at championships past and see if there’s anything remotely interesting from a statistical point of view. And failing that, find some boring things from a statistical point of view to share.

We’ve all seen the records, of course, so there’s no need to regurgitate the results. Instead, let’s look at different numbers. Like, do teams score more points in the final now?

Errr…. No…

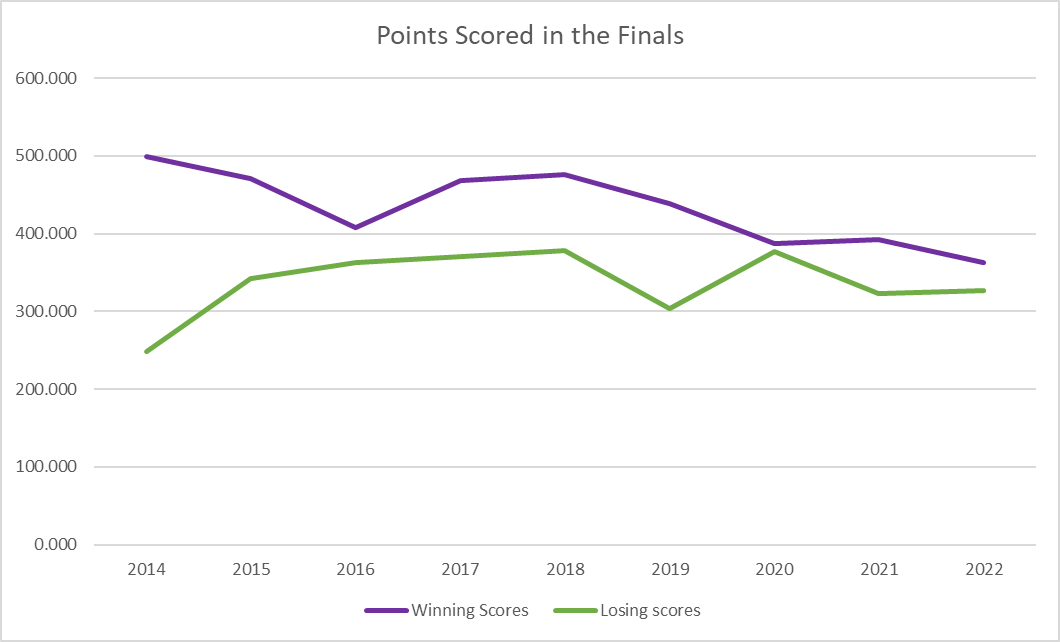
Teams that win the final are scoring less, while teams that lose the final are scoring… incredibly consistently (if we ignore the Brees in 2014). It’s good news for excitement – there’s only been one comeback victory (Dyna Hard, 2017) but at least there are closer matches. The second legs of the last three finals – 2020-2022 – have all been won by the team that lost the first leg, after both legs were won by the same team in five of the first 6 finals.

But how about the split of total points across the two legs?

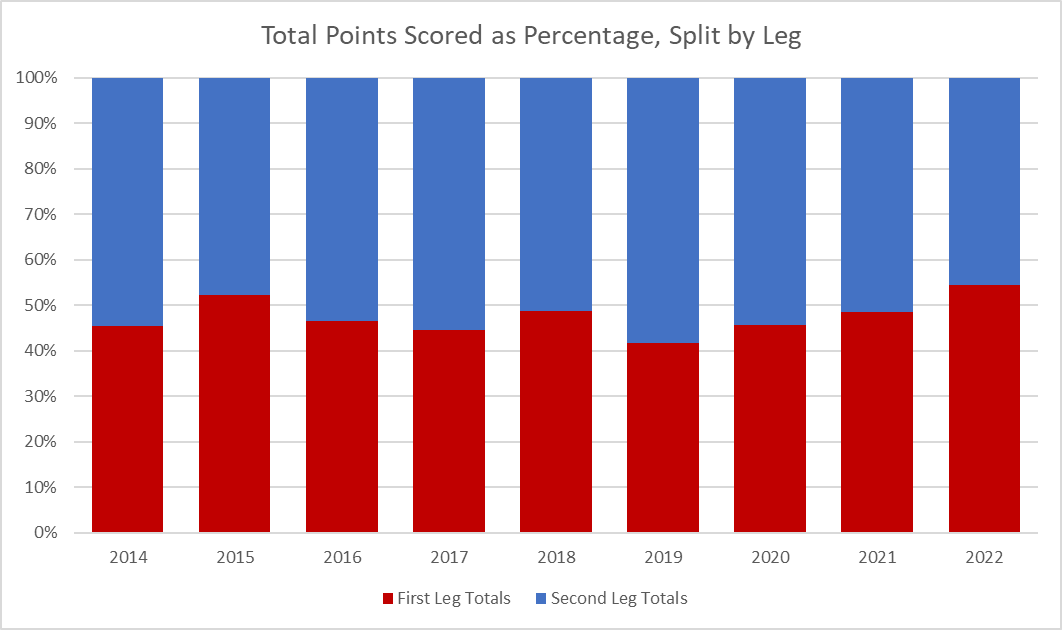
Only two of the nine finals have had more points scored in the first leg than the second. Rather than getting used to each other and neutralising each others attacks, it seems that familiarity breeds explosive offense and an eye for the opponents defensive weaknesses. Or maybe that was a conclusion we could draw if these were actual teams actually facing each other, rather than random players unaware of the importance of their performance in the Dynabowl world.

We can also see, in the top chart, that total points rose to 2018 and have been falling since then. Someone who cares more would probably go back and check the scoring changes we put in place to see if they align.

I can be bothered to do one quick check though. There’s a ranked list of total points scored, per team, per season. Because there’s been an extra game since 2021, we can’t quite compare like for like, but for total points scored to the end of week 16, 9 of the top 20 team seasons have been after 2018, while 11 of the bottom 20 seasons have come in the same period.

Given there were five seasons in the ‘high scoring finals period’ (2014-2018) and only 4 since, this might indicate a slight drop in scoring overall. Especially as the 6 worst seasons were all between 2020 and 2022.

So there we have it – finals are more exciting (CLOSER GAMES) and less exciting (FEWER POINTS) than ever!

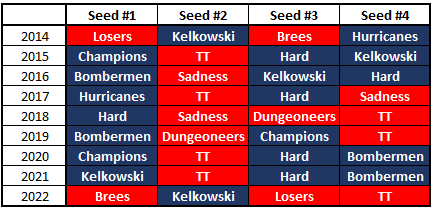
Seeding! Does it matter?

What I mean by that is, are the higher seeds more likely to win the title? Let’s take a look…

NB: Third/Fourth determined by third place playoffs

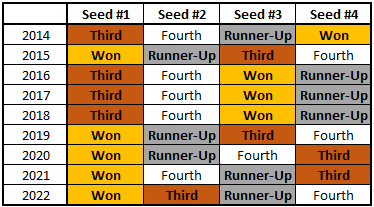
I’m kind of astonished that no one has looked at this before. The abject failure of the number 2 seed to do anything notable at any point is pretty crazy. It took until 2022 for the second seed to win a 2-game match-up (ie the final or 3rd place playoff). The first seed dominance of the past 4 years is also a surprise. In fact, the first seed has always won the 2-game match-up, and in 7 of those 9 years that has been against the number 2 seed.

The run of wins by number 3 seeds also seems like a bit of a surprise. However, in 2016, Kelkowski held the same record as the #1 seed Bombermen (and the #4 seed Hard), in 2017 Dyna Hard were a game behind the #1 seed Hurricanes (then Firebirds), but were league top scorers, 50 points ahead of the #1 seed, while in 2018 the number one seeds were the 13-0 Dyna Hard, who were destined to fail.

Just out of curiosity, I assigned 3 points for a win, 2 for runner-up, 1 for third and 0 for 4th. The number 1 seed gets 19 points, #2 gets 7, #3 17 and the fourth seed gets 11 points. That should really put things in perspective. Idle speculation and shit-stirring, but the top two seeds go to the winners of Peter and Tim. Guess what, 7 out of 9 #1 seeds have come from Tim, bookended by Peter (Losers in 2014, Brees in 2022).

Red for Peter, blue for Tim

Using the patented 3 for a win, 2 for runner-up, 1 for third scoring system, Tim clocks in with 33 points while Peter only racks up 21 across the nine years, but then with only two titles to show for it – both coming in years when the division managed to send 3 teams to the playoffs – that’s probably to be expected.

So back to the exam question – does seeding matter? Only in so much as the second seed was usually from Peter and they usually lost. What matters most is that the team come from Tim.

Double Hundreds

3 teams have scored at least 200 in both legs of the final, the Hurricanes (né Firebirds) in 2014, Champions in 2015 and the Dungeoneers in 2018. No teams have won the title without scoring 200 in at least one leg (though the Champions really pushed that in 2020, scoring 200.145 in the second leg), while only one losing team has managed to score 200 or more in a single leg of the final (the Tamworth Two in that same final against the Champions in 2020).

Regular Season Results Between Finalists

Every year, every team will play every other team at least once. Twice if they are in the same conference, once in the other conference, though since 2021 teams have had a second game against one team from the other conference.

The table below shows the match-ups in the final and the regular season record between the two teams.

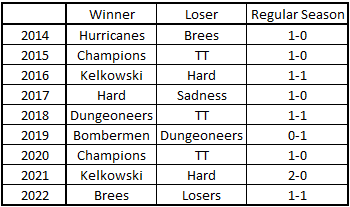
Only once has the team winning the final not beaten their opponents at least once in the regular season. That came in 2019 when the Bombermen used the playoffs as a revenge tour. Having gone 11-2 in the regular season they beat Tamworth Two in the playoff semi-final before knocking off the Dungeoneers in the final – those were the only two teams to beat them during the regular season. Is this more impressive than Dyna Hard going 13-0 and then losing the playoff semi-final in 2018? Almost certainly.

What Can We Learn?

Want to win a title? If you make the playoffs, ideally be the first seed and, if not, be the third seed. Try not to be in Peter and make sure you beat your opponent at least once during the regular season, and score 200 in at least one game week.

2022 Defensive Projections

Chris Braithwaite decided to look at defensive strength and make some projections for the 2022 season:
“Slatz did a write up about team values. You could probably read that if there was a website somewhere. I dunno. But he didn’t include defensive players in that, simply because MFL doesn’t have the data to properly do anything with them given our league settings. So I decided to see what I can do”

Continue reading

A 2022 Preview

Some years ago Ian did a preview looking at the ADP of the players on each team. It’s an interesting idea – because we’re a dynasty league teams will be in different places of a cycle – and the idea was to look at how teams were set up to win now. So I thought I’d repeat it, but with a twist.

In Ian’s analysis he used ADP, but ADP has a couple of problems to my mind – we’re not a redraft league, so we don’t have picks for all players, only rookies, and they can’t be easily equated to salaries. Picks assume an equal value between 1 and 2, 2 and 3 and so on. But if you have a clear top two with a wafer thin difference in value and then a gap to a tier with players 3-5 then this isn’t really reflected. ADP theoretically smooths this a little, as players 1 and 2 should have ADPs around 1.5 and 3-5 around 4, but it still retains the core problem of valuing each pick 1 more than the one before, so the gap between 1.5 and 4 is still an arbitrary 2.5 picks with no recognition that a pick value isn’t a flat amount.

AAV on the other hand says how much of a fixed budget someone is willing to spend on a player. So the difference between 1 and 2 in that ranking could be a couple of cents, while 3-5 is more like a couple of dollars. Also, critically, it’s a currency we use for our salary cap, so it opens up some additional fun options.

Whether it’s ADP or AAV, both methodologies have some similar problems, that I’ll just touch on:
– Not every league runs IDP, and many that do won’t have a full defensive, or will use different defensive scoring. So defensive value isn’t really indicative in the way that offensive is. An example of this, is that only 2 of the top 10 CBs by ADP are even rostered in our league. Because only two CBs have ADP values.
– 2QB leagues are increasingly popular, these inflate the value of QBs significantly, but they do so across the board, so it should balance out on a team-by-team comparison. It does however mean that AAV values for QBs are inflated and so comparison of salary to AAV is less useful at this position.

Anyway, enough of the boring stuff, let’s have a look at how it shakes out.

I could list top AAV by position, but easier just to link you to the AAV info in MFL (note, this link is correct, the one on the MFL homepage is for 2021).

You can access the googledoc with all the data in here, it is a live doc, pulling via the API, so figures may not exactly match.

So, onto the good stuff, who’s got the most valuable team?

Team Value Offense Value
Dyna Hard $905.79 $857.71
Kelkowski $768.82 $707.27
Brees $720.65 $671.62
Champions $705.15 $664.05
Losers $647.24 $634.16
Sadness $638.76 $610.51
Bombermen $579.40 $524.22
The Infamous Two $557.52 $494.21
Dungeoneers $557.19 $548.19
Hawkeman $449.11 $421.77

Let’s start with a positive – the average spend in the dynabowl on offence is $400.20 so I adjusted AAV’s for offence based on that, and everyone’s AAV beats that baseline value, so everyone’s got some value there. Rookie contracts help a lot with that, for example Breece Hall(!) is somehow the top AAV on MFL, and his 20 dollar salary for this year against his AAV is 31 (before rescaling to the baseline of $400), so his salary to AAV rating is 944%. More on that sort of thing in a bit.

Chris is a clear leader here, lead by a receiver group with a total AAV of almost 400 on their own ($397.60), by far the most valuable group in the league, ahead of Ben’s receivers ($308.95). Neil’s bottom placed ranking can largely be traced to this same position group as his receivers value up at only $102.41, significantly behind the next worst in Mike ($174.93) and the Commish ($168.28).

The top RB group belongs to Ian ($280.18) but there’s a cluster of closely matched 2nd placed groups of Pete ($234.88), Chris ($234.52) and Mike ($231.08) and Ben ($225.40). People in auction drafts just don’t like Jonathan Taylor as much as you’d think. The lowest valued RB groups belong to T2 ($122.14) and the Commish ($137.51).

Ian, Pete and Neil have more valuable RB groups than WR groups, where for everyone else it’s the reverse.

It’s closer in the QB group – Max at $158.36 has the most valuable group, just ahead of the Losers ($153.32) and Chris ($149.40). While the Commish has the most valuable TE group ($98.01). While there’s a couple of others who are close, Neil is the only GM who’s QB group is more valuable that one of the two big skill position groups (his aforementioned WR group). Unsurprisingly, everyone’s TEs are their least valuable group.

Defence, as previously alluded to, receives an average spend of $165 in salary. In AAV, the highest total defensive value belonged to T2 at $62. So, yeah, that pretty much makes the point about IDP in our league vs others. The figures are all in the sheet, but I’m not going to waste time on trying to draw any conclusions.

So far, so good. But you can’t and won’t play all these players. So let’s go deeper. What about the starting line-ups?Based on a line-up of 1QB, 3RBs, 4WRs how do the teams value up? (figures rounded)

Team Starters QB RB WR TE
Dyna Hard $460 $68 $127 $215 $50
Kelkowski $416 $78 $174 $149 $15
Brees $440 $40 $147 $230 $23
Champions $427 $56 $140 $215 $14
Losers $431 $80 $144 $188 $19
Sadness $445 $62 $196 $128 $59
Bombermen $360 $85 $110 $120 $45
Tamworth Two $379 $45 $100 $196 $37
Dungeoneers $453 $58 $219 $166 $11
Hawkeman $300 $55 $135 $84 $26

What this highlights is how depth plays a part in total value. Chris’s WR group ($215) is not just not miles ahead now, it’s not even ahead. While it’s still a strong group (stars and scrubs is a legit strategy in Auction drafts), it’s only joint second alongside Max and behind Ben ($230). The gap from these three to 4th and 5th is only 20 dollars too.

Even more of a drop than Chris’ WRs are Ian’s RBs drop from the highest value group to third, behind Mike ($196) and Pete ($219). Who’ve topped the last two drafts, showing that rookie value.

Meanwhile, in terms of overall value… it’s actually pretty tight: Chris leads at 460, but 7 teams are above 414 dollars (90% of Chris’ value). Only Neil, once again let down by his receivers, T2 and the Commish are not in this group.

As I mentioned earlier, one big difference between ADP and AAV is that AAV allows us to compare what someone would pay for someone this year, with what we are paying for someone this year, so we can look at value – both best and worst – in this case, expressed in terms of salary as a percentage of AAV (i.e. lower is better value)

Team Value RB value WR value
Squad Starters Starters Starters
Dyna Hard 51.2% 36.7% 52.7% 37.1%
Kelkowski 59.4% 56.5% 34.0% 92.1%
Brees 47.6% 36.1% 29.2% 53.7%
Champions 47.7% 40.1% 49.8% 45.4%
Losers 58.3% 53.4% 62.3% 78.5%
Sadness 82.9% 90.9% 79.7% 120.6%
Bombermen 67.0% 49.9% 47.1% 84.4%
Tamworth Two 82.4% 84.4% 110.5% 65.9%
Dungeoneers 87.3% 72.8% 20.1% 163.4%
Hawkeman 93.2% 85.3% 79.4% 127.9%

OK, I’m going to start to try and say less as this is already quite long, but some highlights… T2 are the only team paying over 100% of their AAV for their RBs. It’s tough to do, but congrats. Benefitting from back to back 1st picks spent on RBs, the dungeoneers are paying a league-low 20.1%.
At receiver the opposite is true, the dungeoneers are paying a whopping 163.4% of the market values of their receiver. The Sadness are also paying over the odds at receiver and so are the Hurricanes, tough break when they’ve such a low value, but with others where you might be overpaying one or two individuals and driving total salary up (say hello DeAndre Hopkins) in Neil’s case it’s more that people don’t value what he has, so any sort of salary looks like an overpay.
Lastly, the Dungeoneers (87.3%) and Hurricanes (93.2%), led by those high cost receiver groups have the least discount on their offensive squad, though neither is overpaying vs AAV overall. Pete’s cheaper starting group (72.8%) means that he drops out of the top two for starters, replaced by the Sadness who go straight to number one with a bullet (90.9%).

At the other end of the scale, The Brees have the best value overall group and starting group just ahead of Chris by 0.6% for starters, while the Champions are only 0.1% behind in the total offence.

The two things that seem to have the biggest impacts on this are having young receivers who’ve got a good season or two under their belt but are, still on their rookie deal, (Lamb, Chase, Jefferson) or box-fresh rookie RBs (Harris, Walker). Although, as this last table shows, the best value is not always where you’d expect it (in fact, it almost never is):

Team MVP! MVP! MVP! Least Valuable Player
Dyna Hard Kenny Pickett Jalen Raegor
Kelkowski Jalen Hurts Curtis Samuel
Brees Trey Hendrickson Darius Slayton
Champions Jaquan Brisker(!) Quintez Cephus
Losers Justin Herbert Anthony Schwartz
Sadness Cole Holcomb Trey Sermon
Bombermen Demarcus Lawrence DJ Chark (doo doo do do do do)
Tamworth Two Justin Jefferson Odell Beckham
Dungeoneers Joe Burrow DeAndre Hopkins
Hawkeman Malik Willis N’Keal Harry

Of course, value is ultimately a measure of what people are willing to pay for a player, it’s not indicative of how they’ll actually perform. The wisdom of the crowd has C-Mac’s one working hamstring as a top two pick by ADP and the highest value player overall (in PPR formats), so I’m not sure how far to trust it anyway, but if nothing else, it offers an interesting insight into who’s got what would be considered the ‘best’ teams at this point and the best position groups. Meanwhile, should we pass a emergency rule that Chris and Neil should swap receiver groups?

Who is Going to Win the 2018 Dynabowl? by Ian Kulkowski (Hint – it’s not me!)

The question everyone is talking about at the moment is who is going to win this year’s Dynabowl?  When Bendy’s poll first appeared on MFL I excitedly scanned through all of the rosters (I do love a good poll) and determined that Max & Mike seemed the strongest.  I plumped for Mike on the basis of Zeke, Hunt & Freeman at RB, and that was that, decision made and I could now move on with my life.

But no.  That was not the case.  My mind was now racing – have I made the right call?  Have I given enough consideration to Defense, or Special Teams for that matter?  I vowed that this unsubstantiated selection simply won’t do and I needed to look deeper in order to be truly happy with my selection.  And so here I’ll run you through my results and determine once and for all who will win the 2018 Dynabowl.  The results might just shock you to the core! (They won’t).

I wanted a simple method of deciding who had the strongest roster (and more importantly starting 22) so I decided to use positional rankings to determine who was strongest at each position and then use that to guess who is best overall.  Once I started I quickly realised this was a pretty pointless exercise but I’m not one to abandon these kind of fruitless ventures so I ploughed on.  I suppose it ultimately did give me and understanding of where everyone’s strengths and weaknesses lie, including my own, which may help in identifying potential trade opportunities.  Which is good especially seen as I’m such a big trader!  It also proved to be useful prep for the upcoming C’Bowl draft, which seen as my C’bowl record is currently second to none could be quite important.

Speaking of which I really need to improve my early round draft record in the C’Bowl.  Here’s my first two pick in each of the 5 years I’ve been part of the league –

Ian’s first chart

How fucking terrible is that!!  Only 2 finished top 10 at their position (one of whom is Gronk! Duh!) and only 2 more top 20!  I even picked Gurley when he was shit!  No wonder I never make the playoffs.  But look out this year as I’m now fully prepared to not repeat the mistakes I’ve made over and over for the last 5 years!

Where was I? Oh yes, Dynabowl rankings.  We’ll start with the Offense as they are much more easily and reliably ranked.  I used fantasypros consensus draft rankings to rank each position then used those classify each player as one of three categories –

  • stud – automatic plug in and play each week
  • starter – remainder of the top ranked players who would be a starter in our league, so top 10 QB’s, top 25 RB’s top 35 WR’s etc.
  • back up – double the number of starters

I’ve ignored everyone else who is rostered as they are either likely to development stashes or just guys you have a crush on and like to have around (hello 2016 Dynabowl winning QB El Jaguar!). So without any further ado let’s get into it…..

Quarterback

Ian’s second chart

I simply ranked teams QB’s by the ranks of their no.1 as we only need to start 1.  So T2 come out on top with A.A.Ron.  According to the rankings there are 3 teams with no starter quality QB’s – Sadness, Bombermen & Losers, with the Losers barely scraping even a back up in Derek Carr.  Although Bendy’s QB crew are all ranked 13-15 (nice grouping) you could easily see 1 of them breaking the top 10, or even 5.  There will certainly be some selection headaches in the weeks to come!

Check out Pete’s QB’s!!  Whooo boy he has the position nailed!!  Surely a trade opportunity here Pete?

Running Back

Ian’s third table

Max and Bendy both have 2 studs at this crucial position so look well set but they are bettered by Mike with a group boasting 3 studs plus one extra starter!  All those years of early picks are beginning to pay off!  Slatz scrapes into playoff contention here with 1 stud backed up by 2 highly ranked starters.

Things don’t look great for me and Bean here with no studs and a few lowly ranked starters.  Some attention is required here.  Meanwhile Chris’s reliance on No.1 ranked RB Gurley (where were you in 2016??) and his strong WR corps is stark as he has only one other RB ranked inside the top 50, and that’s Kenyan Drake!

Wide Receiver

This is Ian’s 4th table

Max & Chris grade highest on WR’s with 2 studs and 2 starters each.  I’ve put Max on top due to him having 2 in the top 4.  Pete is very close also with 2 studs and 2 starters – all those early picks paying off again?!

My deficiency at WR is clear to see with only one starter rostered.  Slatz is not too far ahead although his strategy of playing the long game with Josh Gordon could finally be about to pay off.

Tight End

Ian’s fifth table – how many of these do you think there are?

As with QB’s I’ve pretty much ranked TE’s by the no.1 on each roster as we mostly start only one.  Neil and Max have the only 2 studs which puts them top of the pile (although Neil currently can’t afford Gronk – watch this space). Pete’s young TE’s – whilst exiting – look a little weak here and slatz doesn’t own a single TE ranked in the top 20!

Offense Summary

Overall Max looks to have the strongest offence grading in the top 3 in each position.  A starting line-up of Brady, Bell, Cook, Ajayi, Hopkins, Julio, Tate, Sanders & Kelce should pile on the points week on week.

Mike isn’t far behind with the strongest group of RB’s and very good WR corps.  QB looks to be his weakness although a Rivers / Goff combo is more than capable of delivering.

Pete & Goody/Mat also boast strong offenses with minimal weaknesses which should enable them to push for the payoffs this year.

And what of Chris?  The Reigning champ is strong at WR but will it be enough to make up for his deficiencies elsewhere, especially RB after Gurley (Shakes fist at 2016 Gurley!)

At the other end of the scale my offense looks dire.  The halcyon days of regular playoff appearances appear to be long gone with a long rebuild process required.  Slatz is in a similar position although his RB’s are showing potential to develop into solid group.

Defence

So that’s the easy part done.  Defence is a bit of a different story as there aren’t really the ranks available that represent the depth and scoring in our league to do the same exercise.  After much research I decided the only way to do it was to come up with my own rankings!  To do this I’ve blended together a combination of FFtoday rankings (as these seems the most representative of Dynabowl scoring and have enough depth) and MFL’s own player projections to create a hybrid IDP ranking which definitely provides an undisputable view of who has the strongest D!  So 2 sets of bollocks rankings combined will surely provide a flawless outcome!  That’s the theory (*sigh).

So how does this play out…..

Defensive Tackle

The sixth one. And it’s not the last…

Malik Jackson is the no.1 ranked DT??! What??!  Well that ridicules my ranking system straight away.  What a waste of time!!!!  Seen as it puts me as top ranked I’m going to plough on with this pointless exercise regardless.  With Nose Tackle Damon Harrison also ranked as a starter (jesus what a load of shit) my strength at the position is secure.  I think I’m possibly doing T2 a bit of a disservice putting them below me as their 2 solid starters are clearly the best DT combo in the league.

Pete and Chris have work to do at this position with no DT’s ranked as starters on their roster.

Defensive End

Still going strong at 7 (seven)

DE is clearly Bendy’s position of strength with 2 studs backed up by another starter.  Max isn’t far behind as he also has 2 studs at the position.  Pete & Chris also look to have a good amount of depth at the top of the rankings although maybe some lineup headaches to come.  Once again I have the number ranked player at the position!

Neil sits at the bottom of the pile for DE’s with no starters on his roster and is the only team with a significant need at this positon.

Linebacker

He’s got to be running out of these soon, right?

Mike and Chris sit comfortably atop the LB rankings with 2 studs each plus at least 2 starters to round out their lineups each week.  My group comes next with 1 stud plus a whopping 6 further starts to choose from (trade anyone?!).

Everyone has starters at this position (hard not to when there’s 40 of them!) but Max , Bendy & Pete are the 3 squads without any studs so sit at the bottom of the pile.

Safety

Number Nine. Number Nine. Number Nine.

Now this where it starts to get silly.  Both the rankings and stat projections are pretty much completely pointless when it comes to DB’s so drawing any sort of conclusion from this isn’t much use!  Nevertheless here we are…..

Goody / Mat are locked in at Safety with 2 studs and a starter.  Chris and Pete also look to be in a nice position.

Neil and Slate sit at the bottom with Slate boasting only one guy raked as a backup.

Cornerback

It’s the last one! I promise. 10. 10 of them!

This is just a random set of numbers so I’m not even going to bother commenting.

Defense Summary

What to make of that load of Shit?

Goody / Mat, Chris and me seem to have the strongest overall units.  Goody / Mat have no real weak spots on D whilst Chris only has holes at DT and CB and we know how he loves to create work for Bendy by heavily streaming those positions.  I think some dodgy rankings have bumped me up the list a little!

Max grades in the bottom half at each position besides DE so his strong offence will have to work hard to make up for his deficiencies in the D.  Bendy is in a similar position although slightly above Max in most areas.

So who will win the 2018 Dynabowl???

To be hones after all that I’m none the wiser.  Probably more confused even!!  The way I see there’s a fairly clear split between who’s going to be challenging for the playoffs and who’s battling for that No.1 pick.  The winner as usual will probably be decided by Kickers & Punters.  So in no particular order –

Playoff contenders

  • East Flanders Dungeoneers – Strong on Offense with crazy QB’s depth, Not bad on D but LB and DT look to be issues.
  • Tamworth Two – No obvious are of weakness with a very balanced roster.
  • Dynasty of Sadness – Strong offence despite lack of obvious starter at QB and no major issues on D besides DE.
  • Champions of the Sun – Extremely strong offence but weak in several positions on D.
  • Dyna Hard – RB a real concern but defense looks strong besides DT & CB.

Fighting for No.1 Pick

  • Here Comes the Brees – a lack of real quality on offence will cost them, Defense looks solid.
  • Dynasore Losers – Still very much in rebuild mode, some signs of building nice young roster at RB & LB.
  • DynaForOne Firebirds – Neil’s roster is so thin there’s lots of work to do to make this a competitive squad. I still don’t know how he’s going to get under the cap!
  • Dynabalster Bombermen – A good offence for Bendy despite his selection headache at QB but Defense may not have enough.
  • Kelkowski Don’t Play by No Dyna Rules – Offense is truly awful in need of a complete rebuild! Not bad on D.

Fun Facts About The 2017 Chatterbowl

The following things are all facts of various kinds from the 2017 Chatterbowl, or Chatterbowl history to date.

  • Three of the previous Chatterbowl Winners scored more points in the final than the the two 2017 Finalists scored, put together (112)
  • Every team has now made the playoffs at least once. The last to join the list were Spunky Beans (Ian Kulkowski) and Martysaurus Sex (Jay Kelly)
  • Every score between 39 and 133 (inclusive) has now been scored at least once
  • The three GMs to have scored the most points are David Slater (8289 in 96 games), Ben Hendy (8280 in 95 games) and Dan Sayles (8276 in 96 games) – 13 points covering those top 3
  • The top 4 players for average points per games have not played all 6 seasons to date (Chris Braithwaite, Dan Smith, Pete Conaghan and James Goodson)
  • Dan Sayles has longest playoff streak (and it’s still active), making the playoffs every year from 2013 to 2017 (5)
  • Other top playoff teams (Total/Active Streak in brackets), Ben Hendy (5/4), David Slater (4/0), Mat Ward (4/4)
  • Mat Ward is the only person to have won 6 games against another GM and not lost to them (he is 6-0 vs Dan Sayles, which is quite remarkable given Sayles’ consistency)
  • No one else has more than 4 wins without also suffering a defeat against that GM
  • Ben Hendy has scored a century in the highest percentage of his matches (28.8%, 23/80 – data excludes 2012, which had 12 teams). Second is Ben Archer (28.1%, 9/32), and third are Max Cubberley and James Goodson (27.5%, 22/80)
  • Dan Smith has been on the receiving end of the most centuries (27.1%, 13/48), Jay Kelly is in second (26.3%, 21/80), while third is split between Ben Archer, Chris Braithwaite, Max Cubberley, Pete Conaghan and Phillip Malcolm (25.0%)
  • 2017 had the lowest scoring average of all seasons of the Chatterbowl to date
    • 2012 – 86.26 – 1 week averaging less than 80 points
    • 2013 – 85.34 – 4 weeks
    • 2014 – 83.13 – 4 weeks
    • 2015 – 84.40 – 2 weeks
    • 2016 – 83.08 – 4 weeks
    • 2017 – 78.85 – 12 weeks
  • The average score put up by Chatterbowl teams in every single week in 2017 was lower than the average score in that week in the combined average for the previous 5 years
    • I realise I have phrased this confusingly – take the average score that every team got in week one of the previous 5 seasons – the average in week one 2017 was less than this. The same goes for week two, week three, etc and so on.
  • The total number of centuries scored in 2017 was 18. This compares to 32 in 2013, 26 in 2014, 25 in 2015 and 28 in 2016.
  • Week 9 of 2017 was the first ever week in which no team registered a century
  • 3 teams failed to register a century in any week of the 2017 season (Chris Braithwaite, David Slater, Jamie Blair)
    • This has happened 3 times before – Phillip Malcolm 2013, Chris Braithwaite 2015, Chris Hill 2015
  • Teams that made the playoffs in 2017 outscored teams who didn’t make the playoffs 85.08 to 72.63, a difference of 12.45
    • The only bigger gap was in 2013 – 17.61 – 94.15 to 76.54
    • The third biggest gap on the list was 8.63 in 2015 (88.71 to 80.09)
  • The top 3 scorers in the 2017 Chatterbowl regular season were separated by 5 points – Mat Ward (1186), Ben Hendy (1185), Neil Hawke (1181). These are the 17th, 18th and 19th top Chatterbowl regular season points totals ever recorded.
    • Chris Braithwaite and David Slater hold all of the top 5 spots in that particular table
  • In the 2017 Chatterbowl Final, 6 of the Andover Anteaters failed to achieve double figures. This is the second time this has occurred (Flutie Flakes – 2013)
  • No player for the Andover Anteaters scored more than 17 points in the Chatterbowl final (Ben Roethlisberger). This is the lowest top-scoring player ever (previous lowest top scoring player, Allen Hurns & Texans DST, 22 points, Brett Favre’s Junk Calls, 2015 final)