Scheduling and Relative Strength

Following on from league schedule chat, I got thinking about the level of luck involved in the schedule and what the chances were of teams getting different amount of wins, considering the number of points they scored each week. It’s important to understand, of course, that just because a team scored a lot of points, it doesn’t mean they could have been consistent winners. If they scored massive amounts in just 3 weeks and at or below average the rest of the season they could look like big time Charlies when actually they were … erm … small time Freddies? Also, some weeks the entire league scored highly so a high score is merely par (weeks 8, 10 and 13 all featured average team scores of 190+), while other weeks the points were low so a high score had the chance to dominate (week 2 had an average score of only 158.7).

The point is that it definitely matters when you score those points, as well as how many of them you score.

So given I have the full weekly scoring available I decided to run some scenarios. In fact, practically every scenario. Sort of. There are some weakness which I am going to acknowledge up front.

So what I did was rank everyone’s score from first to last in the league in each week. From this you can derive the chance of winning in any given week. If you top scored you had a 100% chance of winning. If you were the 5th top scorer you had a 55.55% chance of winning (you could beat 5 teams out of 9 – 5/9 = 55.55%) and thus a 44.44% chance of losing. And so on.

By multiplying your chance of winning in week 1 by your chance of winning in week 2 and so on we can work out the chance of you winning every single game. If we create a list of all possible scenarios (ie every combination of win or lose for every week of the season), we can then work out the likelihood of each scenario. Add up all the scenarios that result in 7 wins and you have the % chance of that outcome.

The caveats:

  1. In week 10 Dyna Hard and Kelkowski had the same score. They didn’t play each other so there was no tie, but this would add a tie into the possible outcomes. This would change the number of scenarios across a 13 week season from 8,192 to 1,594,323. To avoid doing this I have knocked Dyna Hard down by 0.05 points so there’s no tie that week. This means that I slightly under-estimate Dyna Hard’s position in the end results and slightly over-estimate Kelkowski’s, but the difference is minimal.
  2. I have not done this based on feasible schedules that fit with our ‘play your division twice, the other division once’ rules. This is purely done on the basis of how many teams could you beat each week. This means that while it may say a team has a small percentage chance of winning every week or losing every week, this may not actually be the case because that may rely on playing The Sadness or Kelkowski every week.

However, what this does do is provide an analysis of relative strength across the division as well as estimate the role schedule luck played in each team’s performance.

So first off I want to walk you through an example. East Flanders had a 0.13% chance of losing all 13 games in the season. The table below shows the ranking of each weekly points score for the team, the chance of losing in that individual week, and the cumulative chance of losing each week, one after the other:

Score Rank Chance of Losing Cumulative Chance of Losing
Week 1 6 55.56% 55.56%
Week 2 4 33.33% 18.52%
Week 3 10 100.00% 18.52%
Week 4 8 77.78% 14.40%
Week 5 8 77.78% 11.20%
Week 6 7 66.67% 7.47%
Week 7 10 100.00% 7.47%
Week 8 8 77.78% 5.81%
Week 9 9 88.89% 5.16%
Week 10 7 66.67% 3.44%
Week 11 8 77.78% 2.68%
Week 12 2 11.11% 0.30%
Week 13 5 44.44% 0.13%

A decent start and end to the season didn’t cover up a pretty terrible middle.

So doing this for every win/loss combination for every team gives the following table of likely win totals:

Win Expectancy 1

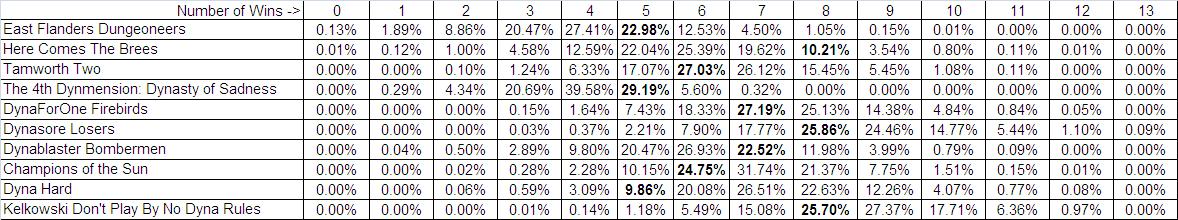
The figures highlighted in bold are the percentage chance the team had of recording the number of victories they actually did record. So Champions of the Sun ended up with 6 wins and there was a 24.75% chance of that happening based on their weekly scores (accepting the caveats listed earlier), while Dyna Hard had just a 9.86% likelihood of getting exactly 5 wins, as they managed across the year.

So for all bar two teams, the chances of ending with the record they ended with was between 22.52% and 29.19%, though only 3 teams ended with the record they were most likely to.

So the next stage is to look at the cumulative win chances – ie adding the percentage chances up as you move along. So each column in the table below shows the chances of winning between zero and n games (n being the number at the top of the column).

Win Expectancy 2

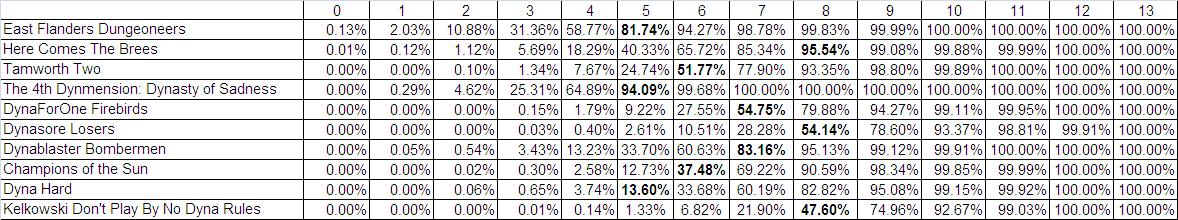
What this is saying is that the higher the cumulative number the luckier you would need to be to get that number of victories, while approximately 50% is where you would expect to be. So in 95.54% of scenarios Here Comes The Brees would win 8 or fewer games and only in 4.46% of scenarios would they win over 8 games. As we can see, there was only a 13.60% chance that Dyna Hard would win 5 or fewer games.

We can also reverse this and produce a table which shows the chances of reaching a minimum number of wins:

Win Expectancy 3

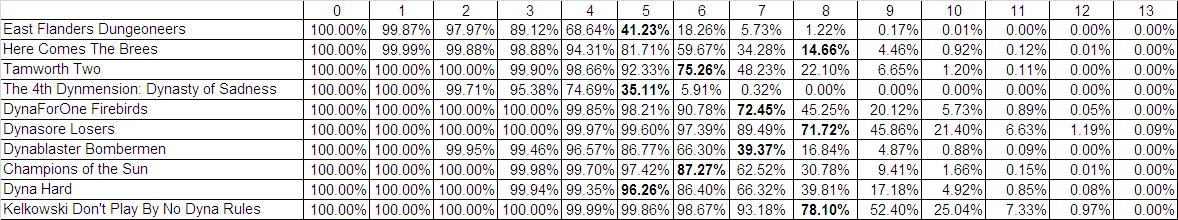
This shows that The Brees had only a 14.66% chance of getting at least the 8 wins they managed, while Dyna Hard were as close to guaranteed as you could reasonably expect to get to hit the 5 wins they did, with over a 96% chance of reaching that level. The Dynasty of Sadness were the second luckiest franchise, with only a 35% chance of getting 5 wins, although they had a better chance of getting 4 wins than East Flanders, while the Champions of the Sun were very lunlucky to register just 6 wins.

So what can we do with all this data? Well, we can use it to create an expected win number. By looking at where the 50% position falls in the above 2 cumulative tables and taking the average of the 2 positions we can see the expected number of wins for each team based on their performance.

Team Expected Wins Exp. Win Rank Actual Wins Diff. % Difference
Kelkowski Don’t Play By No Dyna Rules 8.59 1 8 -0.59 -4.52%
Dynasore Losers 8.34 2 8 -0.34 -2.61%
DynaForOne Firebirds 7.33 3 7 -0.33 -2.50%
Dyna Hard 7.12 4 5 -2.12 -16.27%
Champions of the Sun 6.89 5 6 -0.89 -6.88%
Tamworth Two 6.43 6 6 -0.43 -3.34%
Dynablaster Bombermen 6.11 7 7 0.89 6.88%
Here Comes The Brees 5.88 8 8 2.12 16.30%
East Flanders Dungeoneers 4.18 9 5 0.82 6.31%
The 4th Dynmension: Dynasty of Sadness 4.12 10 5 0.88 6.74%

So most teams were within 1 win of where they would be expected to end up, but Dyna Hard and Here Come The Brees were both over 2 wins difference from what their week to week performance merited.

All told I am pleasantly surprised at how little difference the schedule made for most people. This may be a case of there being so few games it’s harder to separate from the mean, but then again, 20% of the league – a not insignificant proportion – were over 2 games different from their expected level.

What can be said at this point is that we don’t really know if this is a problem or not. Will there always be teams who get very lucky or unlucky or was 2014 an anomaly? Should we look to provide a degree of stabilisation to try to get the best performing teams over the course of the season into the playoffs? Or should we embrace randomness?

Kommish Komment Korner (again)

The fact that the match-ups, in a randomly assigned order, can make a large difference to the outcome of the season – something beyond the control of the GM – seems an unfair punishment (or reward) and if something can be done that removes an element of that, while maintaining the excitement of head-to-head match-ups, my view is it should be included.

What we have is not broken, but there are a few cracks in the facade and it would be nice to address those so that we have a league which is both fun and robust. The magic of the cup will remain, regardless, in the playoff stage. What the regular season should at least try to do is ensure that the best teams end up in the playoffs while the worst teams get the best picks in the draft in order to better themselves and make themselves more competitive. In 2014 the playoffs were 3/4 right in that regard, but it’s not as though the 4th part of that equation was a borderline case. Had Dyna Hard come 5th, just behind Champions of the Sun, the issue wouldn’t have been a talking point (and I realise I am the only one talking about it really so you may not consider it one anyway). But I think it is tough to argue that Dyna Hard merit the first pick of the draft ahead of DoS and East Flanders.

I’m not suggesting a revolution, I’m suggesting evolution. The league is one year old and we knew we wouldn’t get things right the first time. We need to adapt to make the league as good and as fair as possible. I don’t want playoffs to be decided based on all-play or total points or anything. We all put in a lot of time and effort and it is better that we have a system that rewards that time and effort and, where appropriate, skill as best as possible.

This won’t change for 2015 and the above analysis will be repeated after the 2015 season to see how different the league was from actual performance. There will then be a vote sometime in the new year about whether we should change the schedule and/or ranking system for teams. Cases will be made and, whatever the outcome, we will move forward, older and allegedly wiser.

What’s A Pick Really Worth? (The Offence)

After reading Ian’s piece, and the discussion following it, it occurred to me that one of the things we’ve all be struggling with is understanding what the baseline for success for a #1 or #6 etc pick looks like. Last year’s rookie class was headlined by guys like Odell Beckham Jr and Mike Evans, who both look like bargains, but what about in normal or quiet years. How good does a QB or DE have to be to justify a #1 pick, compared to say an RB or WR? That’s what I’m going to attempt to answer. Continue reading

Alternative Uptown Top Ranking the 2014 Season

Some of you may remember that at the end of the last season of the DynaBowl, when tallying up wins and losses and working out the draft order there was some ‘heated’ debate. I forget who was involved or exactly what the outcome was, aside from Dyna Hard, the 4th top scorers in the league in 2014, getting the first pick in the draft.

Anyway, it got me thinking. Firstly, how did a possible perception of unfairness occur and secondly is there anything that could be done to rectify this?

So, one of the quirks with Fantasy Football is how short the season is and how few games are played in a typical, traditional season. 13 games is not very many. It’s less than are played in the NFL, let alone football, basketball, ice hockey or let alone baseball. As such, it’s really difficult to use the season as a marker of true quality.

This is often noted in NFL, but at least in the NFL your opponent on any given weekend (or Thursday night. Or Monday night) has an impact on how you play your game. In fantasy football it would theoretically be possible to be the second highest scorer every single week and not win a game. Or be the second lowest scorer every week and win every game. Obviously the chances are ludicrously small, but it is just about possible. Therefore a win/loss record doesn’t necessarily reflect the strength of the teams.

Extrapolating from this, not only does it mean that the order the picks are made in could be compromised, but so too could the teams making the playoffs. In theory the best 4 teams should make the playoffs, but in 2014 The Brees made the playoffs despite scoring more regular season points than only 2 teams. Again, this isn’t like the NFL (or the Premier League) where a low scoring team can be successful by having a really good defence. A low scoring team has no control over whether they get beaten or not – it’s entirely based on luck.

In a venture like the ChatterBowl this is less of an issue (to me, at any rate), but the DynaBowl is a comparatively serious endeavour, given the time spent assessing rookies for the draft, assessing the value of contracts, managing the cap etc and so on. Given the time spent on managing teams, shouldn’t we work to reward the best teams rather than leaving it up to luck?

Of course, luck will always be present (as will Luck, the unbreakable man). This can be in the form of a defensive player getting 3 of his 5 sacks in one week or a 90 yard pick 6, or it can be that your opponent loses his bets 3 players to a bye the week you play him. I’m not saying we completely eliminate luck – we couldn’t.

What I am saying is that we should look to ways to reduce it so that the best teams are rewarded and the worst teams get the chance to pick from the new players before everyone else.

“But wait!” I hear you cry, “How much does the schedule really affect the standings?”

With our schedule in 2014, every team ended up with 5, 6, 7 or 8 wins. But complete fluke we were really bunched together. With a random re-arrangement of the fixtures, ensuring that no one played the same team in the same week they had before (so every fixture was new), the first variation I have produced the following results:

Team Wins Losses
Dyna Hard 11 2
Dynasore Losers 10 3
Kelkowski Don’t Play By No Dyna Rules 9 4
Tamworth Two 7 6
DynaForOne Firebirds 6 7
Dynablaster Bombermen 5 8
Champions of the Sun 5 8
East Flanders Dungeoneers 4 9
Here Comes The Brees 4 9
The 4th Dynmension: Dynasty of Sadness 4 9

I promise this was complete fluke that the worst team in 2014 ended up on top with this schedule and The Brees came in second from bottom.

Under this scenario our 2014 champions, DynaForOne Firebirds, didn’t make the cut for the playoffs.

The point of this is merely to say that schedule plays a massive part of success and perhaps we should look to remove that element as best we can.

I’m not saying we should just work on total points or anything like that. We all like the weekly competition. But there may be other options that operate as halfway houses, which are just as fun but more representative. Specifically two other options (with further variations thereon).

OPTION 1 – DOUBLE HEADERS

This is pretty simple. Everyone plays two fixtures a week. That’s it. It just doubles the number of games per season giving you a better chance of producing a record that is more representative of a team’s talent.

So I had the original schedule and the schedule used to create the above standings. Using those templates I just rearranged the order of the teams (so if, in week 1 team 1 played team 2 etc, I just changed who team 1 was and who team 2 was (etc and so on), which then created effectively a new schedule. I then created tables for how the season would have gone with the new double fixture lists. There are several versions to demonstrate how different results would have been, each of which is reproduced  below for illustrative purposes and because I have no limit on space. The first of these tables uses the original schedule and the revised one produced above as the two schedules (I used total points, not head to head, as a tie-breaker, for simplicity):

Team Total Points Wins with  schedule 1 Wins with  schedule 2 Total Wins Total Losses
Dynasore Losers 2478.93 8 10 18 8
Kelkowski Don’t Play By No Dyna Rules 2494.355 8 9 17 9
Dyna Hard 2396.135 5 11 16 10
DynaForOne Firebirds 2397.8 7 6 13 13
Tamworth Two 2388.085 6 7 13 13
Dynablaster Bombermen 2297.19 7 5 12 14
Here Comes The Brees 2258.885 8 4 12 14
Champions of the Sun 2392.665 6 5 11 15
East Flanders Dungeoneers 2138.915 5 4 9 17
The 4th Dynmension: Dynasty of Sadness 2008.795 5 4 9 17


Team Total Points Wins with  schedule 1 Wins with  schedule 2 Total Wins Total Losses
Dynasore Losers 2478.93 9 10 19 7
Champions of the Sun 2392.665 7 9 16 10
Kelkowski Don’t Play By No Dyna Rules 2494.355 8 7 15 11
DynaForOne Firebirds 2397.8 8 7 15 11
Tamworth Two 2388.085 5 8 13 13
Dynablaster Bombermen 2297.19 6 7 13 13
Here Comes The Brees 2258.885 7 5 12 14
East Flanders Dungeoneers 2138.915 5 5 10 16
Dyna Hard 2396.135 6 3 9 17
The 4th Dynmension: Dynasty of Sadness 2008.795 4 4 8 18


Team Total Points Wins with  schedule 1 Wins with  schedule 2 Total Wins Total Losses
Dynasore Losers 2478.93 9 8 17 9
Kelkowski Don’t Play By No Dyna Rules 2494.355 7.5 9 16.5 9.5
DynaForOne Firebirds 2397.8 7 9 16 10
Dyna Hard 2396.135 7.5 7 14.5 11.5
Dynablaster Bombermen 2297.19 7 7 14 12
Champions of the Sun 2392.665 7 5 12 14
Tamworth Two 2388.085 6 6 12 14
Here Comes The Brees 2258.885 5 5 10 16
East Flanders Dungeoneers 2138.915 5 4 9 17
The 4th Dynmension: Dynasty of Sadness 2008.795 4 5 9 17


Team Total Points Wins with  schedule 1 Wins with  schedule 2 Total Wins Total Losses
Kelkowski Don’t Play By No Dyna Rules 2494.355 10 9 19 7
Dynasore Losers 2478.93 8 9 17 9
DynaForOne Firebirds 2397.8 6 9 15 11
Dynablaster Bombermen 2297.19 7 8 15 11
Here Comes The Brees 2258.885 9 6 15 11
Tamworth Two 2388.085 5 7 12 14
Champions of the Sun 2392.665 6 5 11 15
Dyna Hard 2396.135 6 3 9 17
The 4th Dynmension: Dynasty of Sadness 2008.795 4 5 9 17
East Flanders Dungeoneers 2138.915 4 4 8 18


Team Total Points Wins with  schedule 1 Wins with  schedule 2 Total Wins Total Losses
Dynasore Losers 2478.93 11 8 19 7
Dyna Hard 2396.135 6 10 16 10
Tamworth Two 2388.085 7 9 16 10
Kelkowski Don’t Play By No Dyna Rules 2494.355 8 7 15 11
Champions of the Sun 2392.665 7 8 15 11
DynaForOne Firebirds 2397.8 7 6 13 13
Here Comes The Brees 2258.885 7 5 12 14
Dynablaster Bombermen 2297.19 6 4 10 16
The 4th Dynmension: Dynasty of Sadness 2008.795 5 4 9 17
East Flanders Dungeoneers 2138.915 1 4 5 21


Team Total Points Wins with  schedule 1 Wins with  schedule 2 Total Wins Total Losses
Dynasore Losers 2478.93 8 10 18 8
DynaForOne Firebirds 2397.8 8 8 16 10
Kelkowski Don’t Play By No Dyna Rules 2494.355 8.5 7 15.5 10.5
Here Comes The Brees 2258.885 7 8 15 11
Dyna Hard 2396.135 8.5 6 14.5 11.5
Tamworth Two 2388.085 7 6 13 13
Champions of the Sun 2392.665 6 6 12 14
Dynablaster Bombermen 2297.19 5 7 12 14
The 4th Dynmension: Dynasty of Sadness 2008.795 3 5 8 18
East Flanders Dungeoneers 2138.915 4 2 6 20

So with this method we end up with more match-ups and more rivalries, but there’s a risk that too many games are happening at once and we lose a bit of focus. It could be more fun or it could be confusing and, frankly, I don’t think we’d know until we did it.

OPTION 2 – VICTORY POINTS

So, under this scenario, each team would get 2 points for a win and 1 for a tie, rather than the traditional W/L result, but what we add in is 2 further points for the top 3 scoring teams in the week, 1 point for the 4 teams that score in the middle and 0 points for the 3 lowest scoring teams. This way, if you are the second top scoring team in a week, and you lose to the top scoring team, all is not lost! You still get 2 points towards your playoff push.

Want examples? Why sure. In week 1 of the 2014 season, the top scoring team beat the 4th top scoring team while the 2nd top scoring team beat the 3rd top scoring team. So under the victory point scenario, Dynablaster Bombermen would have scored 1 point despite the loss and Dyna Hard 2 points, despite their loss.

What would last season’s table have looked like?

Team Victory Points Scoring Points Total Points
Kelkowski Don’t Play By No Dyna Rules 16 18 34
Dynasore Losers 16 17 33
DynaForOne Firebirds 14 15 29
Here Comes The Brees 16 12 28
Dynablaster Bombermen 14 12 26
Champions of the Sun 12 14 26
Tamworth Two 12 13 25
Dyna Hard 10 14 24
The 4th Dynmension: Dynasty of Sadness 10 8 18
East Flanders Dungeoneers 10 7 17

Less of an impact – the same 4 teams in the playoffs and a little shuffling lower down, but I think you’d agree that it is a slightly more fair representation of the quality of teams.

The advantage is that even if you’re clearly beaten or going up against a team that is much stronger you still have something to cheer and getting a few more points in your Monday night game could give you an extra point and push you a step closer to the playoffs.

OPTION 3 (?!?) – COMBINED DOUBLE HEADERS AND VICTORY POINTS!

Using the first double header table to construct a double header and victory points table, we get the following:

Team Total Wins Total Losses Victory Points Scoring Points Total Points
Dynasore Losers 18 8 36 17 53
Kelkowski Don’t Play By No Dyna Rules 17 9 34 18 52
Dyna Hard 16 10 32 14 46
DynaForOne Firebirds 13 13 26 15 41
Tamworth Two 13 13 26 13 39
Champions of the Sun 11 15 22 14 36
Dynablaster Bombermen 12 14 24 12 36
Here Comes The Brees 12 14 24 12 36
The 4th Dynmension: Dynasty of Sadness 9 17 18 8 26
East Flanders Dungeoneers 9 17 18 7 25


Ian Kulkowski’s 2014 Rookie Valuation Rankings

Guest submission from DynaBowl GM Ian Kulkowski

The previous article and the upcoming Dynabowl Rookie draft got me thinking about the value of rookies.  This is an area that if a GM gets right could be the key to long term Dynabowl success which after all is what we all crave.  In 20 years time the only thing that will matter is the numbers of Championships you have won.

The 10 Dynabowl GM’s have employed different strategies when it comes to building their rosters. Some have taken a ‘win now’ approach (Firebirds, Losers, Kelkowski) and applied a correspondingly low value to rookies.  Some have taken the ‘dominate in the future’ approach (Bombermen, Dyna Hard, CotS) and have loaded their rosters with potential and don’t mind paying for it.  Some have taken the radical ‘win never’ approach (Sadness) and loaded up on valuable Safeties.

Which will turn out to be the triumphant strategy only time will tell.  Or maybe there is no correct way, maybe it’s all just down to dumb luck in the end.

One thing we do know going into the 2015 rookie draft is what the initial costs of our drafted rookies will be.  There’s a handy table in the rules section of the Dynabowl website (www.dynabowl.com) –

Pick Round 1 Round 2 Round 3 Round 4
1 $20, 4 years $10, 3-4 years $6, 2-3 years $3, 1-3 years
2 $19, 4 years $10, 3-4 years $6, 2-3 years $3, 1-3 years
3 $18, 4 years $10, 3-4 years $6, 2-3 years $3, 1-3 years
4 $17, 4 years $10, 3-4 years $6, 2-3 years $3, 1-3 years
5 $16, 4 years $9, 3-4 years $5, 2-3 years $2, 1-3 years
6 $15, 4 years $9, 3-4 years $5, 2-3 years $2, 1-3 years
7 $14, 4 years $9, 3-4 years $5, 2-3 years $2, 1-3 years
8 $13, 4 years $8, 3-4 years $5, 2-3 years $2, 1-3 years
9 $12, 4 years $8, 3-4 years $4, 2-3 years $1, 1-3 years
10 $11, 4 years $7, 3-4 years $4, 2-3 years $1, 1-3 years
11 $11, 4 years $7, 3-4 years $4, 2-3 years $1, 1-3 years
12 $11, 4 years $7, 3-4 years $4, 2-3 years $1, 1-3 years (and all deeper picks)

So I thought if I applied to these costs to each of the rookies selected in 2014, ranked by their initial auction value I could somehow gage where, if at all any value could be achieved.

Round 1

Pick 1 – Sammy Watkins

Auction value $37, Rookie Value $20

Watkins was one of the highest ranked rookies going into last season (behind only Sankey possibly) so it’s no surprise he attained the highest auction value.  At $37 this is way above what he would cost as a rookie.  Watkins was the 26th ranked WR in our game last year with 133 points which in any normal season would be stellar for a rookie.  Still Watkins will likely improve and should become a fixture in the top 20 WR’s.  If he ever had someone decent throwing to him his value would be even greater.

So the conclusion is if you’d taken Watkins with the first pick at $20 I think you’d be pretty happy with the value you’d got.  See where I’m going with this now?  No?  Not sure I do either.  Anyway….

Pick 2 – Brandin Cooks

Auction value $33, Rookie Value $19

The second highest ranked  rookie WR prior to last year’s draft was probably Cooks, especially given his nice landing spot with the Saints.  The $33 the Bombermen paid is again more than the $19 the 2nd pick in the rookie draft would have cost. Cooks ended up as the 59th ranked WR last year with just 88 points.  This came however in an injury shortened season where Cooks missed the last 6 games with a broken thumb.  His per game points were 8.8 ranking him 25th amongst WRs.  Looking forward Cooks is now the only receiver remaining in New Orleans so has tremendous potential, however the future remains unclear for the Saints so it’s difficult to judge how good a position being their no. 1 WR will be going forward.

At $19 though I think you would be pretty pleased with your investment of the no. 2 pick in Cooks.

Pick 3 – Teddy Bridgeater

Auction value $30, Rookie Value $18

Manboob clearly has the biggest mancrush on Teddy.  It makes me sick.  Of last season’s rookie QB’s he was probably most people’s no 1 by a small margin though I doubt many would have him ranked as the no. 3 rookie.  Bridgeeater was the 22nd ranked QB last season behind the likes of Ryan Fitzpatrick and Alex Smith and just ahead of Kyle Orton.  He should improve this season and possibly trouble the top 10-15 QB’s.

$18 would represent reasonable value for Bridgeeater, there are however a number of ‘safe’ older top 15 QB’s in our league who cost much less (Rapistberger $8, Tannehill $2, Manning $1, Romo $4) so maybe using the pick differently would be wiser.

Pick 4 – Mike Evans

Auction Value $30, Rookie Value $17

Evans had an exceptional season as a rookie last year finishing as the no. 10 overall WR in our game with 177 points.  He has the opportunity to improve this season with a potentially improved QB situation with Heisman trophy winner and No.1 overall pick in this years NFL Jameis Winston behind center.

Evans is up there with the elite WR’s straight away so $17 represents exceptional value.

Pick 5 – Carlos Hyde

Auction Value $28, Rookie Value $16

Hyde was backup to Frank Gore in his rookie season with the 49ers hence he ended up as the 50th ranked running back with 69 points.  With Gore now gone Hyde will get his chance as feature back so this year will be when his value is revealed.  If Hyde doesn’t produce competition will come from Reggie Bush so he’s by no means a cert.

Determining Hyde’s value is difficult at this stage.  If he makes the 49ers backfield his own and ends up as a top 15-20 back then the $16 investment is worthwhile.  If he ends up in a committee then that price may not end up looking that good.

Pick 6 – Bishop Sankey

Auction Value $22, Rookie Value $15

Sankey was the no.1 ranked rookie going into last season but didn’t achieve that position amongst our rookies.  We must have known something as Sankey disappointed last year finishing 43rd amongst RB’s despite being the lead back at Tennessee.  He will get another shot as the lead back but will be on a shorter leash with this year’s 5th round pick David Cobb competing for time in the Titans backfield.

At this point $15 looks like poor value as there is a big chance Sankey could be a bust.

Pick 7 – Johnny Football

Auction Value $21, Rookie Value $14

Manziel’s rookie season was a disaster as he failed spectacularly to live up to the hype and spent the majority of the season as backup to Brian Hoyer for the Browns, ending up with a stint in rehab.  It’s doubtful whether Manziel will make any impact this or any year although competition in Cleveland is never too fierce so his time may come one day.

Currently Manziel has very little dynasty value so $14 would be wasted.

Pick 8 – Jadeveon Clowney

Auction Value $20, Rookie Value $13

The no. 1 overall pick in last year’s NFL draft Clowney was unsurprisingly the highest priced rookie defender in our auction.  Last year was a write off for Clowney after having two lots of surgery on his knee.  Health will continue to be a question going into the 2015 season and it remains to be seen if Clowney can get back to where he was.  If he does he will surely cement himself amongst the top LB’s in the game.

A fit Clowney should be amongst the top scoring LB’s but does $13 represent good value even here?  Probably just about although if you look at the top scoring LB’s from last season only 5 of the top 25 cost more than $4 with most costing only $1.

Pick 9 – Ryan Shazier

Auction Value $19, Rookie Value $12

A surprise pick at no. 9 in our draft it’s fair to say the Steelers 1st round pick was probably not regarded as one of the top fantasy prospects.  Like Clowney Shazier suffered with injuries in his debut season reducing him to only a handful of starts making it impossible to make a judgment at this stage.

Similarly to Clowney if Shazier delivers a fully fit season he could be amongst the top LB’s.  It is however doubtful whether this is enough to represent value at $12.

Pick 10 – Tre Mason

Auction Value $16, Rookie Value $11

Mason was amongst the top RB prospects in last year’s rookie class and ended up rounding out our first round of rookies.  After quickly usurping Zac Stacy & Benny Cunningham atop the Rams RB depth chart Mason performed well finishing 27th amongst RB’s despite not playing in the first 5 games.  Going into 2015 Mason again finds himself 2nd on the Rams depth chart behind this year’s first round pick (and best of class amongst 2015 rookie backs) Todd Gurley.  He undoubtedly has the ability to be a serviceable back but the situation doesn’t look great for the time being in St Louis.

At $11 Mason was decent value last year but the situation in St Louis makes the future uncertain.

Kommish Komment Korner

It’s worth noting that all of these players (I believe – I’ve not researched this Komment) were taken in the auction and the rookies taken in the post-auction roster filling exercise went much, much cheaper. Partially this was down to the by-then depleted finances of franchises but it was also, I believe, influenced by the fact that people were not directly bidding against each other. It is much easier to say “$19” for Ryan Shazier when someone has just said “$18” directly before you than it is to say “I’ll pay a maximum of $20 for Shazier” when you have no idea what else is also going on. The roster-filling stage had lots of bet-hedging going on and players went much cheaper than at auction. At least that’s how I’m explaining my overspending.

Drafting the 2014 Rookies

OBJ

The 2014 DynaBowl season is in the books and the 2015 rookie draft is just around the corner so now seems like a good time to look back at how the 2014 rookie draft might have gone, had it been a thing and had we known what we know now about the last year’s rookies.

I’m not looking at this from a team need perspective, merely ranking the players in the order that I might have had them on my draft board if I knew then what I know now. Maybe.

1. Odell Beckham Jr – New York Giants/Dynasty of Sadness

The star of the season, the star of the Madden cover for 2015 and the star of Tinder profiles around the world. Probably.

Also, the player most likely to become a super hero.

2. Mike Evans – Tampa Bay Buccaneers/Champions of the Sun

The consensus number 2 rookie last year is the number 2 rookie in this revision. Only he’s behind a different guy this time. He’s very tall, which may help prevent some of the many INTs Jameis Winston is going to try to throw this year.

3. Sammy Watkins – Buffalo Bills/Dyna Hard

Had a more typical rookie WR season, and one which, in normal years, would be considered outstanding. Last year was not a normal year for rookie WRs. If Buffalo ever find someone who can throw a football (or even look like they’ve seen a football before), he could turn out to be very special indeed.

4. Jeremy Hill – Cincinnati Bengals/Dynablaster Bombermen

A weak year for rookie running backs, but Hill overcame the odds and has left the Bengals with a nice decision to make over how best to utilise him and Geovani Bernard.

5. Brandin Cooks – New Orleans Saints/Dynablaster Bombermen

He got injured, yes, but that doesn’t really matter for this. The key was he looked like he belonged and, given his mentality, he’s only likely to improve. May not become an elite guy – he’s too small for that – but if he becomes Randall Cobb 2.0 I’ll be very happy.

6. Kelvin Benjamin – Carolina Panthers/Dynablaster Bombermen

He was basically the only WR the Panthers had last year. Now they have Funchess to play opposite him he won’t attract quite so much attention. However, he drops a few too many balls. Improve that stat and he would leap a few slots.

7. Jordan Matthews – Philadelphia Eagles/Dynablaster Bombermen

The Eagles have slowly removed every other potential WR1 from their books leaving Matthews as the main man. For now. Agholor could change that, but, for now, the leading WR in a Chip Kelly offense is a desirable component.

8. Aaron Donald – St Louis Rams/Here Comes The Brees

The first defensive player on the list and the first of two Rams/Brees rookies. High scoring in his rookie season, finishing 2nd at DT behind Suh. Unlikely to become JJ Watt (which is like saying a member of Coronation Street is unlikely to become Neo from the Matrix) (And I don’t mean unlikely to become Keanu Reeves, I mean actually Neo), but likely to remain a top scoring defensive player for years to come.

9. Carlos Hyde – San Francisco 49ers/Dynablaster Bombermen

Had a time share role with Frank Gore and showed he can be a solid, though not spectacular back. Probably a FF RB2 going forward now that the job is his alone to lose.

10. Tre Mason – St Louis Rams/Here Comes The Brees

On performance last year he might deserve to be a couple of slots higher. After the signing of Gurley in the 2015 rookie draft he might deserve to be a couple of slots lower. For now he can sit here.

11. Jarvis Landry – Miami Dolphins/Tamworth Two

OBJ’s college roommate. The pair practiced one-handed catches together. The Dolphins now have a crowded roster with Stills, Cameron, and the newly signed DeVante Parker, but Landry could play a big role going forward.

12. Charles Sims – Tampa Bay Buccaneers/Here Comes The Brees

Came in as the third man in line but Doug Martin is made of biscuits and the Buccs are thought to be promoting Sims to starter for 2015.

13. Teddy Bridgeater – Minnesota Vikings/Dynasty of Sadness

Terrible pro-day and his hands are too small. Isn’t that the received wisdom? In 2014 he was head and shoulders above the other rookie QBs.

14. Martavis Bryant – Pittsburgh Steelers/Dyna Hard

Solid first season that would be seen a good building block for a rookie WR were it not for every WR above him on this list.

15. Austin Sefarian-Jenkins – Tampa Bay Buccaneers/Dynablaster Bombermen

Tight Ends typically do very little in their first season. ASJ did very little in his first season, but he did a little more than Eric Ebron. He looked more up to speed with the NFL and he was playing with a terrible QB. In 2015, he’ll be playing with a slightly better (though considerably more rapey (allegedly)) QB.

16. Jerrick McKinnon – Minnesota Vikings/Champions of the Sun

Showed some decent glimpses in a time-share role with Matt Asiata and with AP’s role up in the air a chance could be there for the taking. Or he could be Christine Michael in colder climes and never amount to anything.

17. Kyle Fuller – Chicago Bears/Dynasty of Sadness

Had a fast start to his time in the league and managed to be one of the best defensive Bears – a title with much competition. Finished 2nd in CB points for the year. Spectacular arrival.

18. Andre Williams – New York Giants/Dynablaster Bombermen

Adequate.

19. Khalil Mack – Oakland Raiders/Champions of the Sun

Showed enough potential to get Raiders fans very excited. As the team rebuilds, should become the leader on defence and could become something pretty special.

20. Bradley Roby – Denver Broncos/Dynablaster Bombermen

An excellent first season, placing 12th overall in the league for CB points, and behind only Fuller in the rookie positional ratings.

21. Cody Parkey – Philadelphia Eagles/East Flanders Dungeoneers

The first real skill position player to make the list.