For this week’s Stat Blat I thought I’d take the subject of my week 2 Stat Blat from last season and expand it. In Week 2 of the 2015 season I looked at the average points from 2014 and 2015 through two weeks to looks for early indicators of squad improvement and design, as well as looking at potential points on average to see what impact GM selection was having. I’ll be doing a similar idea this week. For those of you who might claim I’m only doing this again so I don’t have to think of a new thing to look at, you’re quite right.
Reality Bites
Below is a table of comparisons for average points in weeks 1-2 of 2014, 2015 and 2016, ordered by 2015 finishing order.
| Team Name | 2015 Standing | 2014 Wk2 | 2015 Wk2 | 2016 Wk2 | POA Diff |
| Champions | 11-2 | 1-1 (181 poa) | 2-0 (192 poa) | 1-1 (216 poa) | +11/+24 |
| Tamworth 2 | 7-6 | 2-0 (185 poa) | 1-1 (167 poa) | 0-2 (184 poa) | -18/+17 |
| Dyna Hard | 10-3 | 0-2 (168 poa) | 2-0 (223 poa) | 0-2 (176 poa) | +55/-47 |
| Kelkowski | 6-7 | 2-0 (212 poa) | 0-2 (153 poa) | 1-1 (160 poa) | -59/+7 |
| Bombermen | 6-7 | 0-2 (168 poa) | 0-2 (156 poa) | 2-0 (224 poa) | -12/+68 |
| Sadness | 4-9 | 0-2 (129 poa) | 0-2 (154 poa) | 1-1 (174 poa) | +25/+20 |
| Losers | 6-7 | 2-0 (175 poa) | 1-1 (167 poa) | 1-1 (190 poa) | -3/+23 |
| Dungeoneers | 5-8 | 1-1 (161 poa) | 2-0 (158 poa) | 1-1 (171 poa) | -3/+13 |
| Breeses | 6-7 | 1-1 (146 poa) | 0-2 (152 poa) | 1-1 (191 poa) | +6/+39 |
| Firebirds | 4-9 | 1-1 (137 poa) | 1-1 (181 poa) | 2-0 (206 poa) | +44/+25 |
The obvious story on the positive side is the Dynablaster Bombermen. After a disappointing 2015 they’ve come out gangbusters in 2016 with a massive 68 point average performance jump from 2015. A big part of that has to be their receivers with Brandin Cooks, Kelvin Benjamin and Jordan Matthews all in their 3rd years now and established as the number 1 options on their team.
Behind the B-men there are a cluster of teams showing significant improvement in the 20s range. The Firebirds have started stronger each year of the Dbowl so far and have been propelled to a 2-0 start by the surprising strength of their defence, averaging 112 points per game, the best in the league. The Dynasore Losers have also improved on 2015 and have had their strongest start yet, despite being 1-1. Offensive improvement is key here as the team is averaging 15 points more on offence through 2 games then they did in 2015, much of it contributable to a shift to Carson Palmer at QB and Matt Forte’s huge workload in New York.
The Sadness have shown steady improvement now for two years but when you consider that they still only averaged 174 points this year so far then it’s clear that this is just the continuing story of a team struggling towards mediocrity after an awful initial draft. Still, improvement is improvement and the team is young. If they jump 20 points again next year they could find themselves 2-0. Lastly, the Champions (in every sense of the word) may be 1-1 but have shown improvement again this year. This may not be a sign that they are in for another dominant year though as they actually started slowly last season. The second highest average points scored shows that they are still a force to be reckoned with though.
On the other hand, you have to look at Chris Braithwaite’s Dyna Hard With A Vengeance and wonder what went wrong. They were hugely improved last season but seem to have lost all of that positive gain this year, losing 47 points on average. As I highlighted in my preview, the running backs are a problem with none of them averaging over 10 points a game but the WRs are struggling too. Only Antonio Brown is over 20 total points, none of the rest are even close. The offence is averaging less than 100 points a game. Only the Firebirds are worse and, unlike Neil’s team, Chris’ defence is not firing on all cylinders.
Interestingly, Chris is the only team to be averaging less points than this time last year. Every other team is showing improvement. This doesn’t seem to be a result of scoring changes as it’s actually the offences that are scoring higher than last year’s averages, rather than the defences. Teams as a whole are averaging 189 points compared to 184 from last season. Maybe we’re all just getting better at this shit?
Is It Indicative?
Is there really any point to this? Does performance in the first two weeks of the season actually tell you anything about how a team will do that season? Below is each team’s Week 2 Average and Season Average.
| Team Name | 2015 Wk2 | Wk2 Rk | 2015 Season | Season Rk | POA Diff |
| Champions | 2-0 (192 poa) | 2nd | 11-2 (217 poa) | 1st | +25 |
| Tamworth 2 | 1-1 (167 poa) | 4th | 7-6 (189 poa) | 3rd | +22 |
| Dyna Hard | 2-0 (223 poa) | 1st | 10-3 (199 poa) | 2nd | -24 |
| Kelkowski | 0-2 (153 poa) | 9th | 6-7 (189 poa) | 3rd | +36 |
| Bombermen | 0-2 (156 poa) | 7th | 6-7 (183 poa) | 4th | +27 |
| Sadness | 0-2 (154 poa) | 8th | 4-9 (179 poa) | 5th | +25 |
| Losers | 1-1 (167 poa) | 4th | 6-7 (176 poa) | 7th | +9 |
| Dungeoneers | 2-0 (158 poa) | 6th | 5-8 (168 poa) | 9th | +10 |
| Breeses | 0-2 (152 poa) | 10th | 6-7 (171 poa) | 8th | +19 |
| Firebirds | 1-1 (181 poa) | 3rd | 4-9 (178 poa) | 6th | -3 |
The thing that jumps out to me straight away is the reasonably consistent rate of improvement for teams. 5 of the 10 teams improved by 19 to 27 points over the course of the season on average. This, presumably, is down to a combination of waiver wire pickups and starting lineup adjustment as the stars stashed on your bench in week 1 and 2 start to show. The biggest risers were Kelkowski. Looking at their lineups it’s noticeable that players like Blake Bortles, Brandon Marshall (LB), Reggie Nelson and Kwon Alexander weren’t in the starting lineup in week 1 and other big performers like Spencer Ware and Malik Jackson weren’t even on the squad yet.
To me it seems telling that the only team to lose average points (who didn’t start out abnormally hot like DynaHarder) was the Firebirds. Neil only added 8 players through blind-bid waivers last season. The four teams who added the most players? Champions of the Sun (42), DynaHarder (40), Tamworth Two (30) and Kelkowski (28), i.e. the four teams in the playoffs at the end of the season. Obviously there is a lot more to being successful in the Dynabowl than constantly churning through waiver wire additions but there’s no denying that the right pickups can have a huge effect and, just like the draft, the more tickets you buy to the lottery the more chance you have to come away with a Josh Norman, a Spencer Ware, an Allen Hurns, a Whitney Mercilus or a Willie Snead.
As far as the question of whether week 2 results are indicative or not is concerned, no team except Kelkowski moved more than 3 positions from their Week 2 Ranking to their Season Ranking. You can improve in your score in the early weeks for sure but the best/luckiest GMs will also be improving so your ability to make up ground on those people is limited. However, it is definitely possible to stagnate and not improve over the season. Everyone around you will be getting better and their scores will be getting higher. You need to do everything you can, whether that’s waiver wire additions, trades or rotating in from your bench wisely, to improve with them.
Weekly Stats
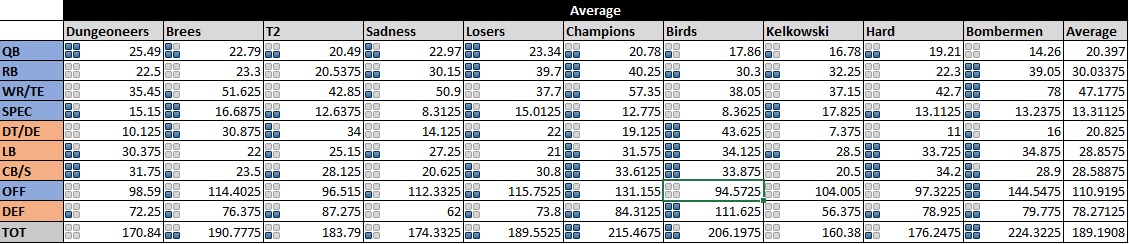
Here are your weekly averages for week 2.
Weekly Peter vs Tim Watch
Week 1: Peter (average) 179.68 vs Tim (average) 192.14. Tim wins. 1-0 to Tim (victory margin 12.46)
Week 2: Peter (average) 184.04 vs Tim (average) 200.91. Tim wins. 2-0 to Tim (victory margin 16.87)
Season to Date: Peter (average) 181.86 vs Tim (average) 196.53. Tim leads (margin 14.67)