Tag: stats

MAX’S STAT BLATS! Week 6

Better late than never!  Or maybe not.  I’ll leave that up to you.  In week 4 I took a look at every team’s offensive performance so far in 2016 and compared it to their 2015 performance to look for improvement and decline.  This week I’ll be doing the same with the defense.  To the stats!

2016 Week 1-6 Average vs 2015 Average
Dungeoneers Brees T2 Sadness Losers Champions Firebirds Kelkowski Hard Bombermen
DT/DE -6.31 4.90 -8.94 1.80 -3.83 4.10 1.40 7.85 -5.02 -2.05
LB -0.29 8.69 3.39 -3.05 7.57 -4.63 3.14 -6.71 -1.17 3.46
CB/S 4.13 2.63 3.08 -9.36 -3.03 -9.20 5.86 -3.58 7.45 -1.51
DEF -2.46 16.22 -2.47 -10.61 0.71 -9.73 10.39 -2.44 1.26 -0.10

Defensive Line

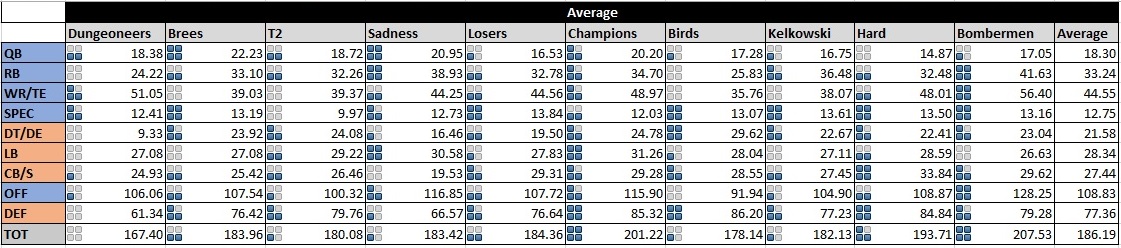
Winners: Kelkowski are crushing it on the D-line this year!  Nearly 8 points up on 2015!  Look a bit deeper though and it has, perhaps, some of the qualities of a mirage.  Firstly, JPP and friends are averaging 22.67 points per game, slightly above average for the D-line.  It’s an improvement but it’s a movement from bottom of the pile to mid-table obscurity.  Secondly, that average is propped up by a massive 63 points in week 3 when the ghost of Malik Jackson briefly turned up to spook Ebeneezer Kelkowski.  Across the other 5 weeks they average 14.6 points, a number better only than Pete’s damp paper bag of a D-line.  Despite losing Aaron Donald, the Brees are functioning better than last season too.  Part of this is due to replacing the best DT in fantasy football with the second best in Fletcher Cox but Michael Bennett and Cameron Jordan are both solid producers too.

Losers: Oh T2, we knew thee well.  After triumphing in the “underwhelming running back” stakes last time out, Goody and Mat show us that they can disappoint on both sides of the ball.  Some of this decline is due to missing pieces (Gerald McCoy and Chandler Jones have been absent much or all of the year) but I think we see an impact of the scoring changes here.  T2 hit big on Kawann Short and Gerald McCoy last season and DTs are probably the group to take the biggest hit from the downgrading of big plays.  Both have scored very well but those 40 point games should be gone now for the most part.  A lot of last year’s big DT scorers have done worse through the start of 2016.  The Dungeoneers d-line is also down 6 points but I don’t think I can kick Pete anymore so let’s leave it at that.

Linebackers

Winners: There are two clear winners in this category, the Brees and the Losers.  Both units were very poor last season so, like Kelkowski’s D-Line, this improvement puts them in the middle of the pack rather than raising them to the top of the charts.  Slatz invested in the position in free agency and the draft with Paul Posluszny and Markus Golden delivering and Deion Jones and Leonard Floyd looking strong through the start of their rookie seasons.  The Brees, meanwhile, seem to have gone for the “2015 Josh Norman” effect and just picked up a player from waivers having a monster season in Lorenzo Alexander.  51 of the 99 points they’ve scored at LB in the last three weeks have been from him.  Improved play from Will Compton and Shaq Barrett is helping but to maintain this improvement they need Alexander to continue playing out of his skin.

Losers: What would Max Cubberley say if you asked him about the decline of his linebackers (4.5 points down on last season).  He’d tell you that they’re still scoring more than anybody else’s linebackers so you can go fuck yourself.  He’d probably also whinge on about injuries and players moving position but lets not give him a platform.  Kelkowski’s overall defensive decline continues here with their linebackers regressing the most out of all the teams (6.7 points down on last season).  Their situation is the reverse of the Losers’ and the Brees’.  Kelkowski’s LBs were among the best in the business last season and this year they’re just… average.  D’Qwell Jackson and Brandon Marshall are the main culprits here and Stephone Anthony’s reduced playing time at strong side LB for the Saints leaves them short a little bit of depth.  Zach Orr is a good wire pickup though who should be able to compensate for that.

Defensive Backs

Winners: Yuk.  Defensive back analysis.  Well, Dyna Hard and the firebirds are both doing better this season than last.  Rodney McLeod was a great pick-up for Chris and Aqib Talib’s 3 INTs so far this year certainly don’t hurt.  Chris’ DBs are comfortably the highest scoring in the league so far this season and his main problem now is the potential for PLOBbage.  With 43 cornerbacks to choose from on any given week, it’s no wonder that Neil is doing well but the PLOBbage is real here.  Trying to predict S and (particularly) CB scoring week on week is far from easy and although Neil has done a good job it must be frustrating to look at your bench every week and see the road not taken.

Losers: The Sadness and the Champions both show an equal decline at the DB spot.  For Cubberley the situation is similar to his LBs.  Despite losing 9 points a game on 2015 the Champions still have the third highest scoring set of DBs in the league so this decline is as much a result of an outlying season of success as anything else.  With Reshad Jones gone for the season now though Maxxxxxx will have to look deep into the waiver wire to try to maintain the pace.  The Sadness, on the other hand, are, by nearly 6 points per game, the worst secondary in the Dbowl.  Their decline is from mediocrity to abject failure.  Looking at the scores of his players for the year to date though you wouldn’t think you were looking at a secondary so adrift from the rest of the field.  To be honest, they’ve scored from disappointing to average every week rather than terribly and this slump is really a result of having no big weeks so far.  A couple of INTs this week could see them pick up and return closer to the average.  DBs, eh?  It’s a funny old game.

Defence

Winners: Although his DB improvement is the best, Neil has improved across the board on defence this season, scoring over 10 points more than last year per game.  At 86.20 points per game, his group is the best in the Dbowl at the moment but the week on week stats show a sharp decline.  In weeks 1-3 the Birds averaged 108 points per game on D.  In weeks 4-6 that number fell to 64 points per game.  He’s had big pieces on bye in each of those weeks but it’s something to keep an eye on.  If I was Neil I would be moving to address the obvious gap at DE in his roster.  Maybe drop a CB or two to make ro… who am I kidding, he’s never going to drop any CBs.  If you think improving by 10 points is impressive, though, look at the Brees!  A 16 point increase!  That takes them to averaging 76 points per game which is… wait… it’s bang average.  Putting aside Pete’s crepe paper D (sorry Pete) the Brees were about that far adrift of everyone else last season.  Really, it would have been more impressive to be so bad two seasons in a row.

Losers: Let’s just check in with Max Cubberley on what he thinks about his defence averaging 10 points fewer than last season.  “Go fuck yourself!”  Thought so.  The Champions are still the second best scoring defence but last week was a low outing from them and this week’s lineup has a few too many waiver wire pickups for my liking.  We’re not too far off a week where Cubberley starts 4 Texans’ linebackers and that can’t be good for anyone.  The Sadness are the other team to have lost 10 points off their average.  Most of that is their secondary, as discussed, though and there is some cause for optimism that those numbers could improve over the season.  Despite Linval Joseph’s monster season so far the Sadness only show a 2 point improvement on the D-Line though and there is room for improvement here.  Mangboob’s DEs are not inspiring and a little trade magic could really help him to improve those numbers and make a playoff push in Peter.

Overall

Winners: It will come as no surprise to anyone that the Bombermen are the big improvement on last season, averaging 24 points more per game than last season’s disappointing results.  You’ll have seen that they were conspicuous by their absence in today’s report and, indeed, their defence is operating at a 0.1 loss on last year.  All of this is offensive improvement and it looks like it has the legs to go all season.  The Sadness are the other big improvement, nearly 15 points up on last year.  This is despite giving 10 points away per game from their receivers and it shows the difference that a certified stud like Zeke Elliot can make.

Losers: Last season’s hot ticket, the Champions of the Sun, are back scrapping with everyone else this year, down 10 points on defence and 6 points on offence.  Despite all of this they’re still scoring well but some thinness at RB and secondary is coming home to roost and they’re now in a position of relying on Trevor Siemian week on week for production.  After them, Tamworth Two are having a ‘mare this season, giving away 8 points a game.  LeSean McCoy is keeping their running game above water on his own and it’s really just the D-line and special teams (!) that account for the decline.


Weekly Stats

TABLES!

Don't Look Blat In Anger
Don’t Look Blat In Anger

Peter vs. Tim Watch

Week 1: Peter (average) 179.68 vs Tim (average) 192.14.  Tim wins.  1-0 to Tim (victory margin 12.46)
Week 2: Peter (average) 184.04 vs Tim (average) 200.91.  Tim wins.  2-0 to Tim (victory margin 16.87)
Week 3: Peter (average) 192.11 vs Tim (average) 212.54  Tim wins.  3-0 to Tim (victory margin 20.43)
Week 4: Peter (average) 175.27 vs Tim (average) 198.18  Tim wins.  4-0 to Tim (victory margin 22.91)
Week 5: Peter (average) 177.50 vs Tim (average) 176.66  PETER WINS.  4-1 to Tim (victory margin 0.84)
Week 6: Peter (average) 170.47 vs Tim (average) 174.70  Sanity is restored, Tim wins.  5-1 to Tim (victory margin 4.23)

Season to Date: Peter (average) 179.85 vs Tim (average) 192.52. Tim leads (margin 12.68)

DELO Ratings 2016

Maybe you’re familiar with Elo ratings, but I’m going to assume you’re not. Arpad Elo was a Hungarian-born American physics professor who developed a ratings system, originally for chess but later applied to all sorts of sports, including American football, baseball and snooker. It’s now used frequently (in a variety of adapted versions) on fivethirtyeight.com to try to find the best team in history in various sports, amongst other things.

The idea is relatively simple, but the methodology is much more complicated. All competitors, be they individuals or teams, start with a ranking – often 1000 or 1500 – and each time they play they add on points or lose points, according to the result. That can just be a win/lose/draw based metric or it can get much more complex to try to account for home field advantage and scale of victory. If the team you beat is very good you score lots of points, if they’re not so good, fewer points. Likewise, lose a game and lose points based on the skill of the opposition – the better the opposition, the fewer points lost.

In order to try to compare eras, previous results from previous years/decades/whatever have to be removed in some manner so the rating only applies to the team of now and ensure they’re not getting false credit for performance too far in the past. Another adjustment 538 have mentioned they make is between seasons. In all sports, the team line-ups change one year to the next. In American sports, the system is set up to try to even the playing field, with the worst teams getting to draft players first. As this is supposed to be a return towards the middle, they adjust their rankings between seasons by reducing above average teams slightly and increasing below average teams slightly so that next season they all start a little closer together.

All this got me thinking, could we develop an Elo system for the Dynabowl? A DELO system, if you will. So I gave it a shot. I’m going to outline my methodology, share my results, and the provide a means to download my source spreadsheet so you (YES, YOU!) can see if you can improve on it.

The first problem I encountered was that Elo is specifically designed for situations where two teams are playing each other with the result changing a teams ranking. While that does occur in fantasy football, the teams aren’t directly influencing each other’s performance. If the top scoring team one week played the second top scoring team, it would be harsh to penalise the second team DELO points when they would have won any other game.

What i decided to do was look at a teams scored in comparison to the weekly average score achieved. If you beat the weekly average your rating goes up. If you drop below the weekly average your rating goes down. I also (pretty much arbitrarily) decided to exclude the top and bottom scores each week from the average. This was a gut based decision where I felt one or other of the numbers being an outlier could sway the overall average too much in one direction or the other so I felt it better to take the middle 8 scores and average them. This may be the wrong approach – I didn’t check it against an average of all 10 – but it’s the one I decided to take and I think I made a working system in the end. You may decide otherwise.

The next step to decide was how to calculate the points. I decided, again arbitrarily, to start every team with 1000 points. It felt like a high enough total that I could get some big enough variation, and it felt in keeping with the Elo rankings I’d seen produced elsewhere.

So how many points should get added on or taken away? The obvious answer is however many points above or below average the team scored that week. However, I needed to reflect the way Elo works. As I said, with Elo you get more credit for beating a good team than a bad team and so on. Here I thought that if a team has a lower DELO rating than average and scores well it should get ‘extra credit’, while a poor team scoring poorly shouldn’t be penalised as much as a good team performing badly.

This led me to produce a weighting spread. I said that if a team has a DELO between 950 and 1050 whatever their points difference from average gets added or subtracted at a rate of 100% (i.e. if you were 10 points above average you would get 10 points x 100% added to your DELO. If you start at 1000, your DELO would go up to 1010). The scale then was for every 100 points further away from this central spread you got credited with 10% more or less points. Another example: A team has a DELO of 800, falling in the 750-850 bracket. If this team scores 10 points above average, their DELO would go up by 10 x 120% = 12 points. However, if they scored 10 below average it would only go down by 10 x 80% = 8 points. So a bad team gets more credit for performing well than they lose for performing badly. And vice versa.

Finally, I decided I needed to perform the same between-season adjustment to bring teams back to closer to the 1000 starting point. At first I moved teams 10% closer, but then decided this wasn’t enough so moved it to 20%, which seemed to work. Again, it’s pretty arbitrary, but I’m trying to make a system that seems to represent team skill pretty accurately and this seemed to work. So what do I mean by moving teams 20% closer to 1000 points? I mean if a team had 1100 points at the end of the season, they would lose 100 x 20% = 20 points from their total and begin the next season at 1080. Each team would stay in the same order, but teams with a bigger lead over others would lose more points and the field would close up again, pending the next season’s battle commencement.

Now, I said finally, but there is a final, final step I made, but I applied this later, after I decided the system wasn’t working properly. Before that, I was still pretty happy, but I needed to leave it for a while and come back with a fresh mind. When I did, I decided that, despite the intra-season adjustment, not every team quite matched up by the end of the season to where their talent seemed to lie. I thought some more about 538’s Elo system for eras of sports and how they had to be removing old activity from the ranking to make sure they were appropriately evaluating the current team and I realised my rankings still included too much residual effect. I played around with some options until I found one that appeared to work.

I hit upon a formula which removed half the ranking points earned (or lost) in the same week of the previous year. Again, this feels arbitrary, but again it seems to reach the point where teams are fairly evaluated for their most recent performances. Specifically, their most recent season long performances (i.e. 16 games).

So what does all this show? Here’s a table:

2014 2015
Low Week High Week Final Low Week High Week Final
East Flanders Flahutes 754 16 998 2 754 724 6 799 1 760
Here Comes The Brees 873 16 1021 5 873 760 15 928 7 793
Tamworth Two 968 10 1100 6 976 926 5 1106 14 1087
The 4th Dynmension: Dynasty of Sadness 739 14 953 1 782 836 7 922 14 856
Dynasore Losers 988 1 1185 12 1156 885 14 1149 3 905
DynaForOne Firebirds 907 4 1254 16 1254 1021 16 1255 1 1021
Dynablaster Bombermen 967 9 1041 12 1021 903 12 1065 4 997
Champions of the Sun 1000 6 1149 14 1144 1120 1 1395 16 1395
Kelkowski Don’t Play By No Dyna Rules 1040 1 1166 8 1161 1022 4 1121 14 1049
Dyna Hard 1005 2 1126 11 1086 1087 6 1280 14 1265


Remember, these scores essentially represent the the sum total of performance over the previous 16 weeks. They should kind of link to the total points scored, but when you scored them matters. Scoring a lot of points in a week when, overall, comparatively few points were scored will net you a lot more DELO ranking points than scoring them in a high scoring week. But sure, you could use points scored as a measure. But would that be a fair way of comparing teams across seasons? A high scoring team in a high scoring year may be less impressive than a slightly lower scoring team in a much lower scoring year. This accommodates for that.

And what’s the first thing it tells us? That Max’s winning team in 2015 was quite significantly better than Neil’s winning team in 2014, and even Dyna Hard in 2015 were better than Neil’s team. However, the context that needs to go with that is that Firebirds had a shocking start to 2014. In week 4 they had the second lowest DELO in the league (907), and they recovered from that point. They scored DELO 347 points from week 5 to week 16. Champions of the Sun, by comparison, scored only 198 across the same 12 weeks in 2015. So the Champions were more consistently good. They won 11 regular season games scoring over 3800 points in the process. The 2014 Firebirds, by comparison, snuck into the last playoff slot on the last week of the season with a 7-6 record, scoring 3480 points, before producing an incredible post-season. In fact, the 100 DELO points scored in week 16 is the greatest gain or loss by any team in any given week.

From this, perhaps we can say that the Firebirds produced the most dominant stretch, but for the season as a whole, Champions of the Sun were the better team.

Tune in next time for a breakdown of Offensive, Defensive and Special Teams DELO!

Access the file of data HERE!.

MAX’S STAT BLATS! – Week Seven

In last week’s Stat Blat, whilst looking at the Dynablaster Bombermen, I noted that their defensive line had been an area of weakness but something they’d addressed already with the trade for Aaron Donald. Well, this week the Dynablaster Bombermen’s defensive line scored 75.5 points on their own. That got me wondering about the highest and lowest performances from each positional group through both seasons so far. Was 75.5 a record high for a defensive line? Surely it must be! Read on to find out.

Note: Week 17 of the 2014 season was not included when collating these results.

QB

Highest:

1 Firebirds 37.12 S1 W7 Rusty Wilson
2 Tamworth Two 36.6 S1 W10 Aaron Rodgers
3 Firebirds 36.36 S1 W16 Rusty Wilson
4 Tamworth Two 34.92 S2 W3 Aaron Rodgers
5 Firebirds 34.24 S1 W5 Rusty Wilson


The running here are obviously dominated by God’s chosen QB (Wilson) and the Arm of the Doubtful (Rodgers). It’s a classic battle between good and evil.

Lowest:

1 Sadness 0.00 S1 W1 “Fuck You” Cam Newton
2 Breeses 0.36 S1 W16 Andrew Luck
3 Dungeoneers 1.84 S2 W5 Nick “Cunt” Foles
4 Sadness 2.62 S1 W6 Teddy Bridgewater
5 Losers 2.72 S1 W14 Peter Manning


Fun fact: In week 14 of season 1, David left Andy Dalton (26.28 points), Joe Flacco (24.36 points) and Derek Carr (22.36 points) on the bench in favour of Peter (2.72 points). Now, kids, that is how you PLOB yourself right up. For those of you wondering, Andrew Luck did not leave that game injured. He threw for just over 100 yards with 0 TDs and 2 interceptions. Impressive stuff.

RB

Highest

1 Breeses 74.2 S2 W5 Isaiah Crowell, Devonta Freeman, Doug Martin
2 Breeses 65.6 S2 W7 Devonta Freeman, Doug Martin, Lamar Miller
3 Firebirds 61.8 S1 W16 CJ Anderson, Jeremy Hill, Marshawn Lynch
4 Tamworth Two 61.6 S2 W6 Chris Ivory, LeSean McCoy, Jonathan Stewart
5 Champions 61.4 S1 W14 Le’veon Bell, Isaiah Crowell, Latavius Murray


Come on, who saw that coming at the start of the year? Who also saw Isaiah Crowell and Doug Martin each appearing in 2 of the 5 best RB performances of the Dynabowl so far…

Lowest

1 Dungeoneers 5.625 S1 W9 LaGarette Blount, Branden Oliver
2 Firebirds 7.3 S1 W6 Chris Johnson, Marshawn Lynch
3 Breeses 8.2 S2 W3 Isaiah Crowell, Doug Martin
4 Champions 8.3 S2 W1 Latavius Murray, Damien Williams
5 Firebirds 8.4 S1 W8 Chris Johnson, Marshawn Lynch


Crowell, Martin, Latavius Murray and Marshawn Lynch have the distinction of being in both the best and the worst RB groups. If I was better at this I’d probably give you some analysis right now. Here’s what I got: blah blah blah analysis blah blah best-selling book Fantasy Life blah blah analysis blah state-the-obvious.

WR/TE

Highest:

1 Kelkowski 109 S1 W1 Randall Cobb, Calvin Johnson, Jeremy Maclin, Cor!Darelle Patterson, Jordan Cameron, Julius Thomas
2 Losers 93.3 S1 W10 Larry Fitzgerald, Jordy Nelson, Emmanuel Sanders, Torrey Smith, Larry Donnell, Jimmy Graham
3 Kelkowski 91.5 S1 W2 Randall Cobb, Calvin Johnson, Jeremy Maclin, Cor!Darelle Patterson, Julius Thomas, Delanie Walker
4 Firebirds 91 S1 W8 TY Hilton, Julio Jones, Eddie Royal, Demaryius Thomas, Antonio Gates, Rob Gronkowski
5 Firebirds 89.7 S1 W6 TY Hilton, Julio Jones, Mohammed Sanu, Demaryius Thomas, Antonio Gates, Rob Gronkowski


We still love you Cor! Darelle! The passing game has never been better than those heady days of the first weeks of the Dynabowl. What a glorious time that was! It just goes to show, it’s a running league.

Lowest:

1 Breeses 12.1 S2 W1 DeSean Jackson, Charles Johnson, Steve Smith Sr., Terrance Williams, Owen Daniels
2 Dungeoneers 14.25 S1 W14 Keenan Allen, Andre Johnson, Brandon Marshall, Kenny Stills, Kyle Rudolph, Jason Witten
3 Breeses 14.4 S1 W9 Dwayne Bowe, Pierre Garcon, Andrew Hawkins, Steve Smith Sr., Zach Ertz
4 DynaHarder 17 S1 W12 Kenny Britt, Julian Edelman, Cecil Shorts III, Sammy Watkins, Jace Amaro
5 Dungeoneers 18.1 S2 W5 Keenan Allen, Amari Cooper, Michael Floyd, Reuben Randle, Coby Fleener


Tough reading for fans of the Brees and the Dungeoneers. Probably not surprising reading though.

SPEC

Highest:

1 Dungeoneers 23.6 S2 W4 Cairo Santos, Andy Lee
2 Sadness 22.725 S1 W9 Adam Vinatieri, Shane Lechler
3 DynaHarder 21.3 S1 W11 Mason Crosby, Marquette King
4 Breeses 21.2 S1 W10 Matt Bryant, Brett Kern
5 Dungeoneers 20.475 S1 W12 Cody Parkey, Mike Scifres


Lowest:

1 Dungeoneers 1.65 S1 W14 Cody Parkey, Mike Scifres
2 Dungeoneers 3 S1 W4 Cody Parkey, Pat O’Donnell
3 Losers 3.3 S1 W16 Justin Tucker, Donnie Jones
4 Champions 3.95 S1 W6 Shaun Suisham, Brad Nortman
5 Firebirds 4 S1 W8 Dan Bailey, Tim Masthay


The Dungeoneers showing that famed consistency hear by having two of the best scoring special teams units and two of the worst. I like that Parkey and Scifres put up over 20 points in week 12 and then under 2 in week 14. Absolute gangbusters.

DL

Highest:

1 Bombermen 75.5 S2 W7 Aaron Donald, Haloti Ngata, Cameron Wake, Mario Williams
2 Breeses 69.5 S1 W10 Marcell Dareus, Aaron Donald, Michael Bennett, Cameron Jordan
3 Kelkowski 58.75 S1 W7 Nick Fairley, Everson Griffen, DeMarcus Ware
4 DynaHarder 55.35 S1 W13 Jonathan Hankins, Ezekiel Ansah, JJ Watt
5 Champions 50.5 S1 W8 Tom Johnson, Robert Quinn, Cameron Wake


Well, there’s the answer to your question. Yes, the Bombermen’s score on the line this week was the highest ever. By a comfortable margin too. The players on that top 5 read very much like a who’s who of defensive line talent, it’s not difficult to see why these guys scored like they did. Plus Tom Johnson’s there too. Good old Tom Johnson. Who’s Tom Johnson?

Lowest:

1 Dungeoneers 1.25 S2 W3 Tyrone Crawford, Demarcus Lawrence, Stephen Paea
2= Sadness 1.5 S2 W1 Sharrif Floyd, Damontre Moore, Devin Taylor
2= Sadness 1.5 S1 W1 Michael Brockers, Jared Allen, Calais Campbell
4 Champions 1.75 S1 W4 Steve McClendon, Mike Daniels, Cameron Wake
5 Bombermen 2.5 S2 W1 Kyle Williams, Cameron Wake, Mario Williams


A round of applause for the Dynasty of Sadness in managed to fashion a tie for 2nd place in the worst D-line performances of all time. Mike and Mark certainly know how to get their defence off to a strong start to the year. Looking at the players in these units it’s very noticeable that one of these is not like the other. 2.5 points for the Williams twins and Cameron Wake would have been unthinkable last season.

LB

Highest:

1 Champions 63.25 S1 W8 Anthony Barr, Jamie Collins, Justin Houston, Wesley Woodyard
2 DynaHarder 57.55 S1 W5 Von Miller, CJ Mosley, Alec Ogletree, Jason Worilds
3 Kelkowski 55.8 S2 W6 Stephone Anthony, Karlos Dansby, D’Qwell Jackson, Brandon Marshall
4 Champions 55.5 S2 W6 Anthony Barr, Shaq Barrett, Jamie Collins, Justin Houston
5 Champions 53.95 S1 W4 Anthony Barr, Justin Houston, Khalil Mack, Wesley Woodyard


It’s like no-one believed me when I said linebacker was the most important fantasy position.

Lowest:

1 Losers 1.25 S2 W3 Ryan Kerrigan, Paul Kruger, Alex Okafor
2 Bombermen 3.5 S2 W7 Connor Barwin, Elvis Dumervil, Sean Lee
3 Firebirds 5 S1 W4 Mason Foster, Julius Peppers, Lawrence Timmons
4 Firebirds 5.75 S1 W3 Mason Foster, Manti Te’o, Lawrence Timmons
5 Dungeoneers 6.25 S1 W8 Connor Barwin, Dwight Freeney, KJ Wright


I seriously don’t know who Mason Foster is. If this week’s Stat Blat has made me realise anything it’s quite how bad Neil’s team was at the start of last season. What a tremendous rags to riches story his Dynabowl triumph was. Someone should film that. With Paul Giamatti playing Neil.

DB

Highest:

1 Bombermen 76.45 S1 W10 Casey Hayward, Bradley Roby, Ha-Ha Clinton-Dix, James Ihedigbo
2 Bombermen 73.2 S2 W4 Stephon Gilmore, Bradley Roby, Corey Graham, TJ Ward
3 Sadness 59.75 S2 W3 William Gay, Jerraud Powers, Eric Berry, Tyrann Mathieu
4 Kelkowski 58 S2 W3 Janoris Jenkins, Jimmy Smith, Mike Adams, Malcolm Jenkins
5 Kelkowski 57.55 S1 W13 Janoris Jenkins, Devin McCourty, Mike Adams, Rashad Johnson


The fact that the Bombermen and Kelkowski each have 2 entries here somewhat belies my theory that DB scoring is entirely random. Note that the presence of more season 2 scores in this entry than others is likely influenced by the point increased for Defended Passes this season.

Lowest:

1 DynaHarder 3.75 S1 W7 Patrick Peterson, Sam Shields, Deone Bucannon, Jonathan Cyprien
2 Sadness 4.5 S1 W10 Travis Carrie, Kyle Fuller, Eric Berry, Tyrann Mathieu
3 Dungeoneers 5 S1 W11 Vontae Davis, Chris Harris, George Iloka, Rahim Moore
4= Losers 6 S1 W4 Darius Butler, Logan Ryan, Chris Conte, Glover Quin
4= DynaHarder 6 S1 W13 Antoine Cason, Patrick Peterson, Micah Hyde, Eric Reid


I can’t help but think that at least three of those entries would make pretty good real-life secondaries. That’s fantasy football for you, I guess.

OFF

Highest:

1 Losers 177.205 S1 W4
2 Kelkowski 165.36 S1 W8
3 Firebirds 164.34 S1 W5
4 Losers 164.21 S2 W2
5 Firebirds 161.62 S1 W14


Lowest:

1 Dungeoneers 52.7 S1 W14
2 Sadness 54.97 S1 W11
3 Breeses 58.345 S2 W1
4 Bombermen 62.19 S2 W7
5 Dungeoneers 64.965 S2 W5


DEF

Highest:

1 Kelkowski 143.6 S1 W13
2 Tamworth Two 142.05 S2 W6
3 Bombermen 130.95 S1 W10
4 Champions 129.25 S1 W8
5 Firebirds 126.55 S1 W16


Lowest:

1 Firebirds 26.75 S1 W1
2 Tamworth Two 27 S1 W16
3 Dungeoneers 32.25 S1 W11
4 Sadness 35 S1 W10
5 Kelkowski 36.5 S1 W14


MAX’S STAT BLATS! Week 6

It’s the start of week 7 of the 2015 NFL season which is, near as dammit, halfway through the fantasy NFL season so, this week, Stat Blats will look at positional groupings in the DynaBowl to breakdown which parts of your team are riding high and which are down in the dumps. I’ll start with the raw data, then do a team-by-team breakdown, looking at the season so far with some slipshod analysis. You’re welcome. You’re all so very welcome.

Quarterback

Team Starters Average
1 Tamworth Two Rodgers, Palmer 21.76
2 Dynaforone Firebirds Wilson, Rivers 18.28
3 DynaHarder E. Manning, Mariota, Stafford 18.03
4 Champions of the Sun Roethlisberger, Palmer 17.57
5 Kelkowski Bortles, Kaepernick, Romo 17.43
6 Here Comes the Brees Brady, Luck 16.77
7 East Flanders Dungeoneers Newton, Tannehill, Foles 16.61
8 Dynablaster Bombermen Ryan 16.21
9 Dynasore Losers Dalton, P. Manning 15.32
10 Dynasty of Sadness Brees, Bridgewater 11.80


Running Backs

For sections under flex consideration I have worked out the average number of starters in each position over the first 6 weeks and divided the average by that number. This produces an average score per player you start at that position, not favouring teams that start more players in one position.

1 Dynasore Losers Forte, Peterson, Lewis (3 starters (2.5 av)) 34.27

(13.71)

2 Here Comes the Brees Freeman, Martin, Crowell, Miller (4 starters (2.83 av)) 37.05

(13.09)

3 Champions of the Sun L. Bell, L. Murray, Rawls, Da. Williams, Spiller (5 starters (2.17 av) 24.95

(11.5)

4 Tamworth Two Ivory, Du. Johnson, McCoy, McFadden, Stewart, K. Williams, A. Williams (7 starters (3 av)) 32.30

(10.77)

5 Kelkowski Blue, Foster, Ingram, D. Murray, Yeldon (5 starters (3 av)) 31.72

(10.57)

6 DynaHarder Charles, Morris, Randle, Sankey, Gurley (5 starters (3 av)) 31.11

(10.37)

7 East Flanders Dungeoneers Forsett, Woodhead, Hyde, Jennings (4 starters (3 av)) 28.05

(9.35)

8 Dynasty of Sadness Abdullah, Blount, M. Jones, Lacy, Vereen, De. Williams (6 starters (3 av)) 26.73

(8.91)

9 Dynablaster Bombermen Bernard, Ellington, Gordon, J. Hill, Da. Johnson (5 starters (3 av)) 25.96

(8.65)

10 Dynaforone Firebirds Anderson, Gore, C. Johnson, Lynch (4 starters (2.83 av)) 19.38

(6.85)


Receivers (WRs and TEs)

1 Dynaforone Firebirds Colston, Edelman, Ju. Jones, Royal, Thomas, Bennett, Clay, Gates, Gronkowski (9 starters (5.17 av)) 60.84

(11.77)

2 Dynasore Losers Agholor, Fitzgerald, Ja. Jones, Moncrief, Sanders, T. Smith, Donnell, Graham (8 starters (5.5 av)) 57.15

(10.39)

3 Kelkowski Baldwin, Cobb, Ca. Johnson, Maclin, Barnidge, Witten (6 starters (5 av)) 48.38

(9.68)

4 Champions of the Sun J. Brown, Evans, Hankerson, Harvin, Hopkins, Robinson, White, Kelce, Reed, Walker (10 starters (5.83 av)) 54.45

(9.34)

5 Dynablaster Bombermen Boldin, Cooks, A. Green, A. Johnson, Matthews, Shorts, Olsen, Sefarian-Jenkins (8 starters (5 av)) 44.47

(8.89)

6 Dynasty of Sadness Beckham, D. Bryant, Crowder, Decker, Ginn, Tate, Wheaton, Allen, Chandler, Escobar, L. Green (11 starters (5 av)) 41.71

(8.34)

7 East Flanders Dungeoneers Adams, Allen, Cooper, Mi. Floyd, S. Johnson, Marshall, Randle, Stills, Fleener, Rudolph (10 starters (5 av)) 41.17

(8.23)

8 DynaHarder Austin, A. Brown, Hilton, Hurns, M. Jones, Watkins, Wright, Bennett, Cook (9 starters (5 av)) 40.33

(8.07)

9 Tamworth Two Coleman, Crabtree, V. Jackson, Jeffery, Landry, Snead, Wallace, Ebron, Rodgers (9 starters (5 av)) 39.48

(7.90)

10 Here Comes the Brees Benjamin, Garcon, D. Jackson, Ch. Johnson, S. Smith Sr., T. Williams, Daniels, Eifert, Ertz (9 starters (5.17 av)) 39.00

(7.54)


Special Teams

1 Dynasore Losers Gostkowski, Tucker, Anger, King 16.86

(8.43)

2 DynaHarder Bryant, McManus, Hekker, Pinion 15.30

(7.65)

3 Dynablaster Bombermen Brown, Schmidt 14.58

(7.29)

4 Champions of the Sun Catanzaro, McAfee, D. Colquitt 13.48

(6.74)

5 East Flanders Dungeoneers Parkey, Santos, Lee 12.56

(6.28)

6 Dynaforone Firebirds Crosby, Koch 12.51

(6.26)

7 Dynasty of Sadness Hauschka, Vinatieri, Lechler 11.91

(5.96)

8 Here Comes the Brees Gano, Jones, Kern 10.91

(5.46)

9 Tamworth Two Carpenter, Coons, Butler, McAfee 10.42

(5.21)

10 Kelkowski Prater, Gould, Huber, Martin 9.53

(4.77)


Defensive Line

1 Tamworth Two McCoy, McDonald, Short, C. Jones, Tuitt, Vernon (3.33 av) 29.67

(8.91)

2 Here Comes the Brees Donald, Howard, Bennett, Cox, Jordan (3.17 av) 27.88

(8.79)

3 DynaHarder Hankins, Harrison, B. Williams, Ansah, Watt (3.17 av) 26.58

(8.38)

4 Champions of the Sun Dareus, Mitchell, Campbell, Carradine, Quinn, Vernon (3 av) 24.54

(8.18)

5 Dynasore Losers Babineaux, Phillips, Siliga, T. Walker, S. Williams, Dunlap, Hughes, Wilkerson (3.33 av) 19.67

(5.91)

6 Dynasty of Sadness Brockers, Floyd, Joseph, J. Allen, Bailey, Clayborn, Moore, Richardson, Taylor (3 av) 16.38

(5.46)

7 Dynaforone Firebirds Atkins, Suh, Edwards, Gilberry, Ch. Johnson, Ninkovich, Tuck (3.5 av) 18.29

(5.23)

8 Kelkowski Brown, Ratliff, Shelton, Avril, Griffen, Jenkins (3 av) 11.25

(3.75)

9 Dynablaster Bombermen Hill, K. Williams, Casey, Liuget, Wake, M. Williams (3 av) 11.00

(3.67)

10 East Flanders Dungeoneers Crawford, Marks, Ealy, Hayward, Lawrence, Paea (3 av) 10.25

(3.42)


Linebackers

1 Champions of the Sun Barr, Barrett, Bowman, Collins, Davis, Houston, Mack (4 av) 42.60

(10.65)

2 Dynasty of Sadness P. Brown, David, Irvin, M. Kendricks. T. Smith, Trevathan, Wagner (4 av) 34.22

(8.56)

3 DynaHarder Alonso, Clowney, Hightower, Laurinaitis, V. Miller, Mosely, Orakpo (3.83 av) 29.51

(7.70)

4 Kelkowski Alexander, Anthony, Cushing, Dansby, Greenway, D. Jackson, B. Marshall, Robinson, Ware (4 av) 30.68

(7.67)

5 Tamworth Two Attaouchu, Freeman, C. Jones, Kikaha, Kuechly, Posluszny, Williamson (3.67 av) 26.12

(7.12)

6 Dynaforone Firebirds Graham, D. Johnson, Ogletree, Peppers, Te’o, Timmons (3.5 av) 23.92

(6.83)

7 Dynablaster Bombermen Barwin, Dumervil, Elliott, Lee, C. Matthews, Shazier (4 av) 25.23

(6.31)

8 East Flanders Dungeoneers D. Davis, D. Harris, Ingram, M. Smith, Worrilow (4 av) 23.17

(5.79)

9 Here Comes the Brees Bradham, Butler, Hicks, Jenkins, Kennard, Lansanah, McPhee, Morgan, D. Smith, Tulloch (3.83 av) 20.91

(5.46)

10 Dynasore Losers Hali, Kerrigan, Kruger, Okafor, Rey, Suggs, Unga (3.67 av) 14.92

(4.07)


Secondary

1 Dynablaster Bombermen Breeland, V. Davis, Gilmore, Roby, Graham, Ihedigbo, Ward 38.88

(9.72)

2 Champions of the Sun Carrie, Carroll, Flowers, A. Jones, Norman, Church, R. Jones, Weddle 38.13

(9.53)

3 Kelkowski K. Jackson, J. Jenkins, Revis, J. Smith, M. Adams, Bethea, M. Jenkins, Nelson 33.70

(8.43)

4 Dynasty of Sadness Butler, Fletcher, Fuller, Gay, Berry, Matthieu, McDonald, Vaccaro 30.03

(7.51)

5 Tamworth Two Amukamara, Rhodes, Shields, Verner, Chancellor, Collins, Rolle, Whitner 28.96

(7.24)

6 Dynasore Losers J. Banks, Joseph, M. Peters, Logan, Gipson, Moore, Quin 28.18

(7.05)

7 DynaHarder Cox, Peterson, Talib, Webb, Bucannon, Cyprien, Pryor, Reid 26.74

(6.69)

8 Here Comes the Brees Darby, Hall, Toler, Verrett, T. Williams, Conte, R. Johnson, H. Smith, E. Thomas, S. Thomas 25.55

(6.39)

9 East Flanders Dungeoneers Haden, Harris, Maxwell, Clinton-Dix, Hill, Iloka, A. Williams 22.68

(5.67)

10 Dynaforone Firebirds Grimes, Sherman, Trufant, C. Williams, Barron, Burnett, Parker, Searcy 19.64

(4.91)


Below is a table that brings each team’s positional ranks, along with their offensive, defensive and overall average points, into one place for easy digestion.

Name QB RB Rec Spec OFF DL LB DB DEF OVR
Champs 4 3 4 4 110 4 1 2 105 216
T2 1 4 9 9 104 1 5 5 85 189
Harder 3 6 8 2 105 3 3 7 83 188
Losers 9 1 2 1 124 5 10 6 63 186
Rules 5 5 3 10 107 8 4 3 76 183
Breeses 6 2 10 8 104 2 9 8 74 178
Bombers 8 9 5 3 101 9 7 1 75 176
Sadness 10 8 6 7 92 6 2 4 81 173
Birds 2 10 1 6 111 7 6 10 62 173
Dung’s 7 7 7 5 98 10 8 9 56 154


The above table shows a clear leader and a clear trailer in terms of average overall score, with the other 8 teams clustered with only 15 points separating them from the Tamworth Two in 2nd to the Firebirds in 9th.

Champions of the Sun – The current front-runners for the Owl show good consistency across all categories, indicating playmakers in most spots. Although their offence is above average, the clear difference maker is the defence, scoring 20 points per week more than the 2nd best defence on average.

Tamworth Two – If I’d done this article last week the Hogs would not have been as high up the tables but that’s what scoring 280 points in a week will do for you. Unsurprisingly, having Aaron Rodgers as your QB lands you at #1 in the QB rankings but the dominant defence from last year is rolling back into form too, after a slow start. An injury to Alshon Jeffery has cost the receiving corps but that doesn’t explain #9 by itself. This is an area T2 should, and are, looking to improve but getting better at skill positions mid-season is never easy. Willie Snead should help but they may want to look at special teams too for an improvement.

DynaHarder – A hot start from the owners of last year’s #1 pick has tailed off somewhat but Chris and Steve’s team is still looking strong even with JJ Watt’s transformation into ‘normal NFL player’. Their low ranking at WR is nothing to worry about as the return of Ben Roethlisberger should carry Antonio Brown back to his previous heights and Martavis Bryant is also now back from suspension.

Dynasore Losers – Oh Peter. Peter, Peter, Peter. Should’ve quit while you were ahead. Manning’s struggles have sunk the Losers’ QB ranking but with Andy Dalton cemented at #1 on the Losers’ depth chart now and Derek Carr waiting to back him up the only way is up. Early-season predictions of doom from the Stat Blats were wide of the mark at RB but spot-on at linebacker where the Kruger/Kerrigan axis from last season has failed to hit form this year, leaving the Losers languishing. Their top scoring offence is covering for now but Slater may want to look into trading for some promising talent on his defence.

Kelkowski Don’t Play By No DynaRules – The Rules started slowly but are now rounding into better form, largely thanks to the return from injury of Arian Foster and the return from ‘getting dropped for a 2 yard loss on every play’ of DeMarco Murray. Expect that mediocre #5 rank at RB to rise. The big holes are at special teams (for a pair of owners who won’t shut up about the value of kickers and punters they don’t seem to have any good ones) and on the defensive line, where rookie tackles, people blowing their own fingers off and under-performing Everson Griffen have left them light. If I was Kelkowski I would be hitting the phones and sounding out other owners with depth at DT or DE on potential deals.

Here Comes the Brees – I thought this team were supposed to be terrible? Everybody told me they were terrible, including co-owner Ben Archee. Instead they’re a team with a few big holes and a few big strengths who have perhaps gone into full rebuilding mode too early. Their high ranking at DL is sure to drop with Aaron Donald traded away but the unlikely power-trio of Doug Martin, Devonta Freeman and Lamar Miller should carry them through at RB. Injuries to DeSean Jackson, Breshad Perriman, Steve Smith Sr and Victor Cruz have left them low at WR, hence the low ranking but, to my mind, there’s enough here to be optimistic.

Dynablaster Bombermen – Well, so much for the Stat Blats pre-season choice for the Owl. Through 6 games the Dynablaster Bombermen have underwhelmed and you can’t really point to any 1 thing as the reason why. The Falcons are 5-1 but Matt Ryan is no more than a low-end QB1 so far. What should have been one of the best RB groups currently looks like one of the worst, whether through injury, game plan or poor play. The saving grace for the Bombermen has been an overpowering set of playmakers in the secondary and solid special teams play. They’ve addressed the problems on the line already with the trade for Aaron Donald at least. In terms of action I think Hendy and Smith have taken the best course with that move. Their offence is horribly underperforming at the moment but the talent is there and this team will score very well when it breaks right. Don’t give up hope!

The People’s Republic of the 4th Dynmension: Dynasty of Sadness – New year, same problem. The Sadness are unlucky to be 1-5 with their average scores showing them to be at the same level as most other teams but they are let down, for the second season in a row, by poor QB play. Laycock and Simpson went all in on Teddy Bridgeeater and they have to be wondering if that was sensible at this point as the 2nd year QBs play has been questionable at best. Brock Osweiler sits on the bench, rubbing his hands gleefully at every wobbled pass thrown by Peter Manning but should the Sadness be looking to get in another pair of hands until that point? The Stat Blats think so. The rest of the team looks ok with no obvious holes except, maybe, DT but that position can be a lottery. A trade for Allen Bailey has shored up DE and the loss of Dez Bryant is always going to hit your receiving corps hard. TE is a position that could use a bump, having said that. How much for Gary Barnidge…

Dynaforone Firebirds – Is this a typo? What are the current champions doing languishing down here in 9th place on overall average score?! Look at those running backs (ranked 10th). Look at that secondary (ranked 10th). Look at those linebackers (ranked 9th). This is a team with some obvious strengths and some hideous weaknesses. Neil has been trying to address some of the holes on defence but without much luck so far. The secondary could do with an overhaul though. At this point it might be worth dropping the lot of them without guaranteed money and just picking up whoever the best free agents are. Could that end any worse? Injuries to Lynch and the underperformance of CJ Anderson explain the poor RB play but Hawke may well be regretting the trading away of Jeremy Hill in the summer (not that he’s done much better). Chris Johnson’s re-emergence and a recent trade for Ryan Matthews help here and should see the position pick up.

East Flanders Dungeoneers – Well done, Pete. You won a couple of games with this shower. Kudos. We knew it would be a long re-building process for the Dungeoneers and so it’s proving. Pete Conaghan is in the midst of a furious reshuffling that has seen him trade many of his players with short-term value for picks or multiple lottery ticket players. It was never going to be pretty in the short term. The offence has been competent, if inconsistent, but the defence is a disaster. What does Stat Blats recommend? Keep on keeping on, Pete. Keep on keeping on. And maybe don’t pick up quite as many Chargers.

MAX’S STAT BLATS! – Week Two

The spreadsheet has been fed this week and my dot matrix printer has finally finished churning out the data for me to pore through.  This week I’ll take a look at the first two weeks performance from 2015 and compare it to the first two weeks from 2014 to see if we can build a picture of where each team’s fortunes will go from here.

Reality Bites

Below are comparisons of performance through week 2 of the 2015 and 2015 seasons, ordered by finishing order in the 2014 season.

2014 Week 2 2014 Standing 2015 Week 2 POA Diff
Dynaforone Firebirds 1-1 (137 poa) 7-6 1-1 (181 poa) +44
Here Comes the Brees 1-1 (146 poa) 8-5 0-2 (152 poa) +6
Dynasore Losers 2-0 (175 poa) 8-5 2-0 (172 poa) -3
Kelkowski 2-0 (212 poa) 8-5 0-2 (153 poa) -59
Dynablinker Obamamen 0-2 (168 poa) 7-6 0-2 (156 poa) -12
Champions of the Sun 1-1 (181 poa) 6-7 2-0 (192 poa) +11
Tamworth Two 2-0 (185 poa) 6-7 1-1 (167 poa) -18
East Flanders Dungeoneers 1-1 (161 poa) 5-8 2-0 (158 poa) -3
Dynasty of Sadness 0-2 (129 poa) 5-8 0-2 (154 poa) +25
DynaHarder 0-2 (168 poa) 5-8 2-0 (223 poa) +55

So let’s get the good news out of the way.  DynaHarder have gone from an 0-2 start last season to a 2-0 start this season, having the highest average points in the process.  The attendant 55 point jump in average score shows that the team has improved hugely over last season’s average start and there is still the return of Martivis Bryant and abhorrent human being Greg Hardy to come.

The other two significant improvements over last season can be seen at the Dynasty of Sadness and, worryingly, 2014 Superb Owl winners the Firebirds. The Sadness were a flimsy excuse for a fantasy football team last year and anything less than a big jump from 2014’s 129 average points would have been a disaster. Whilst the team are still at the bottom end of the points scorers they are not cut adrift like last season and can expect to be competitive. How the Firebirds improved from 2014’s disastrous start to claim the Owl may warrant an article on its own but the team has started strongly this year, being unfortunate to lose with the 3rd highest score in week 1.

On the other side of the ball it would be remiss not to start with Kelkowski’s 59 point plummet from the first two games of last season. Last week I highlighted some of the reasons Jay and Ian might not be surprised by this but the extent of the drop off is alarming. Despite the poor start of the Breeses this year it’s worth noting that they’ve actually started better in terms of their weekly output this year, suggesting all may not be as bleak as first appeared. Could another unlikely playoff run emerge? Another team I believed to have regressed have proved me wrong through two weeks as the Dynasore Losers are still scoring at the same level as the opening of last season. Whether they can power up to the heights of 2014 as they go along remains to be seen.

What Might Have Been

Looking at what the teams actually scored in the first two weeks is all very well and good but to get a full picture of improvement and regression we should also look at their potential points. What do their best line-ups look like compared to last season? This will also highlight where GMs are more directly responsible for good or poor performance with their team selection.

  2014 Week 2 2015 Week 2 PPOA Diff
Dynaforone Firebirds 188 ppoa 228 (79% eff) +40
Here Comes the Brees 210 ppoa 228 (67% eff) +18
Dynasore Losers 212 ppoa 244 (70% eff) +32
Kelkowski 265 ppoa 206 (74% eff) -59
Dynablaster Bombermen 233 ppoa 232 (67% eff) -1
Champions of the Sun 204 ppoa 258 (74% eff) +54
Tamworth Two 261 ppoa 216 (77% eff) -45
East Flanders Dungeoneers 212 ppoa 208 (76% eff) -4
Dynasty of Sadness 206 ppoa 211 (73% eff) +5
DynaHarder 250 ppoa 282 (79% eff) +32

The numbers here back up the findings for the Firebirds and DynaHarder, showing an overall squad improvement to match their gameday improvement. The other big improvers are the Losers and the Champions, both of whom seem to have added a lot of depth between the start of last season and now, whether it was during the season last year, in the off-season or in the draft. The Breeses too can be happy that, whilst they’re squad still has holes, the actions Dan and Ben have taken have strengthened and added depth.

For the other 5 teams the story is either one of maintaining the status quo or of regression. Despite some strong additions, the Sadness seem to only have a squad as good as the start of last season, suggesting inefficient squad selection contributed to the team’s woes at the start of last year. The Bombermen and, surprisingly, the Dungeoneers also seem to have remained on par with the start of last season. The Dungeoneers are a strange one. To the naked eye, the team seems stronger than last season yet the stats don’t back that up so far. It’s early days, and GM Pete is building for the future, but if the team finishes the season not having outperformed last year’s iteration it should go down as a disappointment.

Kelkowski’s woes have been dwelt on enough but they can at least take solace that a 74% squad efficiency is not horrible and they are doing a good enough job of team selection. The Tamworth Two’s drop in potential points isn’t far short of Kelkowski’s however and that should be a cause of concern. The struggles of Alshon Jeffrey and Jonathan Stewart have certainly contributed to this but the defence has taken the biggest hit with Olivier Vernon and the linebacking unit firing blanks so far. It’s early days yet, of course, and defensive scoring is notoriously streaky but this is a situation worth keeping an eye on. The good news is that the Hogs’ 77% efficiency rating is second best in the league so they, at least, making the most of what they have.

In the efficiency stakes both Bens and both Dans will hope to improve their team selection in the coming weeks as the hot hands become clear and depth chart fog starts to dissipate. Both teams are at sub-70% efficiency which is a major barrier to success. David is, of course, PLOBbing the shit out of himself but what else would you expect? The Losers are still 2-0 so maybe his carefree team selection is motivating the troops.

Join me next time on Stat Blats where I’ll be doing something else with stats, probably, unless I’m not.