Tag: Statistics

Championship Game Statistics

It’s the middle of the season, so what better time to look back at championships past and see if there’s anything remotely interesting from a statistical point of view. And failing that, find some boring things from a statistical point of view to share.

We’ve all seen the records, of course, so there’s no need to regurgitate the results. Instead, let’s look at different numbers. Like, do teams score more points in the final now?

Errr…. No…

Teams that win the final are scoring less, while teams that lose the final are scoring… incredibly consistently (if we ignore the Brees in 2014). It’s good news for excitement – there’s only been one comeback victory (Dyna Hard, 2017) but at least there are closer matches. The second legs of the last three finals – 2020-2022 – have all been won by the team that lost the first leg, after both legs were won by the same team in five of the first 6 finals.

But how about the split of total points across the two legs?

Only two of the nine finals have had more points scored in the first leg than the second. Rather than getting used to each other and neutralising each others attacks, it seems that familiarity breeds explosive offense and an eye for the opponents defensive weaknesses. Or maybe that was a conclusion we could draw if these were actual teams actually facing each other, rather than random players unaware of the importance of their performance in the Dynabowl world.

We can also see, in the top chart, that total points rose to 2018 and have been falling since then. Someone who cares more would probably go back and check the scoring changes we put in place to see if they align.

I can be bothered to do one quick check though. There’s a ranked list of total points scored, per team, per season. Because there’s been an extra game since 2021, we can’t quite compare like for like, but for total points scored to the end of week 16, 9 of the top 20 team seasons have been after 2018, while 11 of the bottom 20 seasons have come in the same period.

Given there were five seasons in the ‘high scoring finals period’ (2014-2018) and only 4 since, this might indicate a slight drop in scoring overall. Especially as the 6 worst seasons were all between 2020 and 2022.

So there we have it – finals are more exciting (CLOSER GAMES) and less exciting (FEWER POINTS) than ever!

Seeding! Does it matter?

What I mean by that is, are the higher seeds more likely to win the title? Let’s take a look…

NB: Third/Fourth determined by third place playoffs

I’m kind of astonished that no one has looked at this before. The abject failure of the number 2 seed to do anything notable at any point is pretty crazy. It took until 2022 for the second seed to win a 2-game match-up (ie the final or 3rd place playoff). The first seed dominance of the past 4 years is also a surprise. In fact, the first seed has always won the 2-game match-up, and in 7 of those 9 years that has been against the number 2 seed.

The run of wins by number 3 seeds also seems like a bit of a surprise. However, in 2016, Kelkowski held the same record as the #1 seed Bombermen (and the #4 seed Hard), in 2017 Dyna Hard were a game behind the #1 seed Hurricanes (then Firebirds), but were league top scorers, 50 points ahead of the #1 seed, while in 2018 the number one seeds were the 13-0 Dyna Hard, who were destined to fail.

Just out of curiosity, I assigned 3 points for a win, 2 for runner-up, 1 for third and 0 for 4th. The number 1 seed gets 19 points, #2 gets 7, #3 17 and the fourth seed gets 11 points. That should really put things in perspective. Idle speculation and shit-stirring, but the top two seeds go to the winners of Peter and Tim. Guess what, 7 out of 9 #1 seeds have come from Tim, bookended by Peter (Losers in 2014, Brees in 2022).

Red for Peter, blue for Tim

Using the patented 3 for a win, 2 for runner-up, 1 for third scoring system, Tim clocks in with 33 points while Peter only racks up 21 across the nine years, but then with only two titles to show for it – both coming in years when the division managed to send 3 teams to the playoffs – that’s probably to be expected.

So back to the exam question – does seeding matter? Only in so much as the second seed was usually from Peter and they usually lost. What matters most is that the team come from Tim.

Double Hundreds

3 teams have scored at least 200 in both legs of the final, the Hurricanes (né Firebirds) in 2014, Champions in 2015 and the Dungeoneers in 2018. No teams have won the title without scoring 200 in at least one leg (though the Champions really pushed that in 2020, scoring 200.145 in the second leg), while only one losing team has managed to score 200 or more in a single leg of the final (the Tamworth Two in that same final against the Champions in 2020).

Regular Season Results Between Finalists

Every year, every team will play every other team at least once. Twice if they are in the same conference, once in the other conference, though since 2021 teams have had a second game against one team from the other conference.

The table below shows the match-ups in the final and the regular season record between the two teams.

Only once has the team winning the final not beaten their opponents at least once in the regular season. That came in 2019 when the Bombermen used the playoffs as a revenge tour. Having gone 11-2 in the regular season they beat Tamworth Two in the playoff semi-final before knocking off the Dungeoneers in the final – those were the only two teams to beat them during the regular season. Is this more impressive than Dyna Hard going 13-0 and then losing the playoff semi-final in 2018? Almost certainly.

What Can We Learn?

Want to win a title? If you make the playoffs, ideally be the first seed and, if not, be the third seed. Try not to be in Peter and make sure you beat your opponent at least once during the regular season, and score 200 in at least one game week.

Fun Facts About The 2017 Chatterbowl

The following things are all facts of various kinds from the 2017 Chatterbowl, or Chatterbowl history to date.

  • Three of the previous Chatterbowl Winners scored more points in the final than the the two 2017 Finalists scored, put together (112)
  • Every team has now made the playoffs at least once. The last to join the list were Spunky Beans (Ian Kulkowski) and Martysaurus Sex (Jay Kelly)
  • Every score between 39 and 133 (inclusive) has now been scored at least once
  • The three GMs to have scored the most points are David Slater (8289 in 96 games), Ben Hendy (8280 in 95 games) and Dan Sayles (8276 in 96 games) – 13 points covering those top 3
  • The top 4 players for average points per games have not played all 6 seasons to date (Chris Braithwaite, Dan Smith, Pete Conaghan and James Goodson)
  • Dan Sayles has longest playoff streak (and it’s still active), making the playoffs every year from 2013 to 2017 (5)
  • Other top playoff teams (Total/Active Streak in brackets), Ben Hendy (5/4), David Slater (4/0), Mat Ward (4/4)
  • Mat Ward is the only person to have won 6 games against another GM and not lost to them (he is 6-0 vs Dan Sayles, which is quite remarkable given Sayles’ consistency)
  • No one else has more than 4 wins without also suffering a defeat against that GM
  • Ben Hendy has scored a century in the highest percentage of his matches (28.8%, 23/80 – data excludes 2012, which had 12 teams). Second is Ben Archer (28.1%, 9/32), and third are Max Cubberley and James Goodson (27.5%, 22/80)
  • Dan Smith has been on the receiving end of the most centuries (27.1%, 13/48), Jay Kelly is in second (26.3%, 21/80), while third is split between Ben Archer, Chris Braithwaite, Max Cubberley, Pete Conaghan and Phillip Malcolm (25.0%)
  • 2017 had the lowest scoring average of all seasons of the Chatterbowl to date
    • 2012 – 86.26 – 1 week averaging less than 80 points
    • 2013 – 85.34 – 4 weeks
    • 2014 – 83.13 – 4 weeks
    • 2015 – 84.40 – 2 weeks
    • 2016 – 83.08 – 4 weeks
    • 2017 – 78.85 – 12 weeks
  • The average score put up by Chatterbowl teams in every single week in 2017 was lower than the average score in that week in the combined average for the previous 5 years
    • I realise I have phrased this confusingly – take the average score that every team got in week one of the previous 5 seasons – the average in week one 2017 was less than this. The same goes for week two, week three, etc and so on.
  • The total number of centuries scored in 2017 was 18. This compares to 32 in 2013, 26 in 2014, 25 in 2015 and 28 in 2016.
  • Week 9 of 2017 was the first ever week in which no team registered a century
  • 3 teams failed to register a century in any week of the 2017 season (Chris Braithwaite, David Slater, Jamie Blair)
    • This has happened 3 times before – Phillip Malcolm 2013, Chris Braithwaite 2015, Chris Hill 2015
  • Teams that made the playoffs in 2017 outscored teams who didn’t make the playoffs 85.08 to 72.63, a difference of 12.45
    • The only bigger gap was in 2013 – 17.61 – 94.15 to 76.54
    • The third biggest gap on the list was 8.63 in 2015 (88.71 to 80.09)
  • The top 3 scorers in the 2017 Chatterbowl regular season were separated by 5 points – Mat Ward (1186), Ben Hendy (1185), Neil Hawke (1181). These are the 17th, 18th and 19th top Chatterbowl regular season points totals ever recorded.
    • Chris Braithwaite and David Slater hold all of the top 5 spots in that particular table
  • In the 2017 Chatterbowl Final, 6 of the Andover Anteaters failed to achieve double figures. This is the second time this has occurred (Flutie Flakes – 2013)
  • No player for the Andover Anteaters scored more than 17 points in the Chatterbowl final (Ben Roethlisberger). This is the lowest top-scoring player ever (previous lowest top scoring player, Allen Hurns & Texans DST, 22 points, Brett Favre’s Junk Calls, 2015 final)

MAX’S STAT BLATS! Weeks 1-4

Like a bad 80s pop group the Stat Blats just keep coming back, regardless of whether they’re merely a shadow of their former selves.  This week I take a look at how the 10 Dynabowl teams have started out the season and which units are propping their teams up and which deserve to be put gently to sleep.

East Flanders Dungeoneers

Forging Ahead: Running Backs, Secondary
Stuck in the Mud: Quarterbacks, Receivers

Spearheaded by new draft pick Leonard Fournette and suprisingly-currently-healthy Carlos Hyde the Dungeoneers have the third highest average scoring running back unit in the Dynabowl at the moment.  Both of the aforementioned chuggers are in the top 10 at the position through 4 weeks but Pete Conaghan will be hoping that nothing happens to either of them as the likes of Terrance West and Chris Ivory don’t offer much backup.  As the season develops his reserve strength may improve if Alex Collins and Samaje Perine can make inroads into the starting jobs on their teams but if not those bye weeks are going to hit the Dungeoneers hard at this position.

Another area of strength for the Dungeoneers is their secondary as, again, they are third highest scorers at the position.  Given that the team only has 1 CB (Chris Harris) in the top 50 scorers at the position it will not surprise you to learn that most of this success has come from the tandem safety pairing of Karl Joseph (Oakland) and Kevin Byard (Tennessee) with Ha-Ha Clinton Dix providing able cover for injuries and bye weeks.  Really Pete should be looking to draft in another cornerback or two as with some improvement at this position he could have the best secondary in the Dbowl.

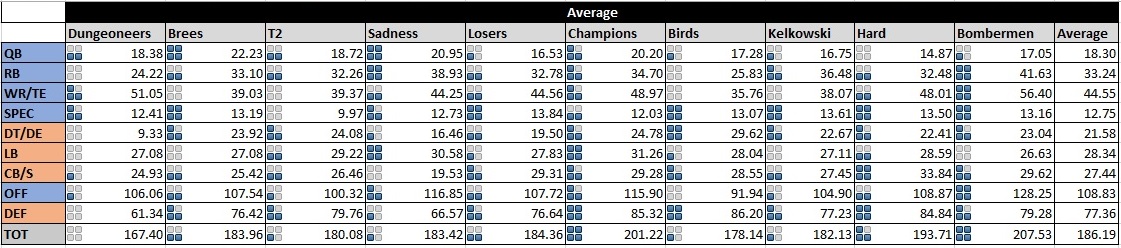
On the frowny-face side, we have the fact that the Flanders Quarterbacks are the lowest scoring unit, on average, in the league garnering a measly 13.32 points per game, nearly 4 points below the average.  Given that both Carson Wentz and Deshaun Watson are in the top 10 at the position however this really has to come down to head coaching decision as Pete put his faith in Cam Newton for the first two weeks, missing Wentz’ big games, and then went to Wentz for weeks 3 and 4, missing Newton and Watson’s big games.  This is a selection headache that Pete Conaghan will have every week going forward but the law of averages says he’s going to start guessing right at some point and that score should creep up.

Really, it’s no wonder that the Dungeoneers’ QBs are struggling with this shower to throw to though.  With only three WRs in the top 60 at the position (and one of those has been riding the pine) the Dungeoneers are the second worst team at this position a whopping 9 points below the average.  Amari Cooper has to answer for some of these problems as the much-vaunted Raiders’ receiver isn’t even in the top 60 wide receivers after four weeks.  With second year pro Josh Doctson failing to spark early on a lot is riding on the shoulders of Keenan Allen and Davante Adams and I’m sad to say that I can’t see this unit improving much in the coming weeks.

Offence Average: 94.24 points (7th)
Defence Average: 78.53 points (4th)
Overall Average: 172.76 points (7th)
Record: 3-1 (1st in Peter)


Here Comes The Brees

Forging Ahead: Defensive Line, Secondary
Stuck in the Mud: Receivers, Linebackers

The Brees’ production line of defensive tackle talent continues apace.  Unperturbed by the departure of Aaron Donald, Ben Archer has continued to dominate at the position with the only thing stopping him having the top two scoring tackles being an injury to Fletcher Cox that has limited his scoring to only 5th at the position.  The tandem of Cox and DeForest Buckner will, injury permitting, continue to rack up points for the rest of the year.  The DE position is the poor country cousin in this unit by comparison but Cameron Jordan is steady as ever, putting up DE1 numbers through 4 weeks, and Michael Bennett is sitting comfortably in the top 20 too.

A top pass defence is made up of a powerful rush and good players in the secondary and the Brees have the latter part of that locked down too having scored the second most points there so far this season, only just behind the Sadness in 1st.  Much like the Dungeoneers, however, this unit is severely unbalanced in favour of the safeties.  The Brees only have one cornerback in the top 30, Justin Bethel.  Given that over half of Bethel’s points came in week 1 when he wasn’t even on the roster this is not great performance.  Thank the Lord for their safeties then.  With 4 players in the top 21 the Brees have top production and strength in-depth enough here to cover bye weeks and injuries.  With Ronald Darby coming back in a few weeks the Brees should be set to keep producing at a high level in the secondary.  Looking at these pieces it’s small wonder the Brees have the best defence in the Dbowl at the moment.

Maybe they should look at converting some of those secondary players to receivers as it’s unlikely they could be much worse than the reprobates currently filling their roster out at the wide receiver position.  Until this week the injury to Allen Robinson and under-performance of Martavis Bryant meant that JJ Nelson was the only receiver in the top 40.  Ben Archer has not sat idly by through this crisis however and this week saw a move made to bring in an elite option in the shape of JJ’s big white brother, Jordy.  The steady WR1 production he will bring to the Brees can anchor them and if Bryant can work into the form they may yet turn out to be ok.  Particularly given the strong showing from their TEs so far this year where, even with Tyler Eifert’s injury problems, they have two guys in the top 10 as both Zach Ertz and Charles Clay have been target hogs for their teams.

The picture is not so rosy at linebacker where, even allowing for the fact that they have only started three players at the position in two of the weeks, the output has been poor.  This is really a story of a lack of elite options as the Brees have 3 guys in the top 40 and Shaq Thompson just outside that.  The dudes they have are doing ok but to pick up performance somebody needs to step up to the table and hit at least high LB2 levels.  With that a unit that is already at the top end of what the Dbowl has to offer could become a true runaway leader on that side of the ball.

Offence Average: 93.54 points (8th)
Defence Average: 85.06 points (1st)
Overall Average: 178.60 points (6th)
Record: 3-1 (2nd in Peter)


Tamworth Two

Forging Ahead: Quarterbacks
Stuck in the Mud: Running Backs, Secondary

Slim pickings for T2 in what has been a disappointing start to the season for them.  With most of their units hovering around average the only thing to really pick out for comment in good terms is the Quarterbacks where they score 3.5 points more than average and are 3rd strongest amongst all Dbowlers.  Not much analysis to be done though, that’s just what happens when Aaron Rodgers is your QB.  Kirk Cousins provides strong backup at the position for bye week cover but T2 better hope Rodgers stays healthy or one of the few things that’s been going right for them this year may disappear.

To say that T2 have been struggling at the RB position seems odd.  On paper their attack of LeSean McCoy, Bilal Powell, Mike Gilislee and Duke Johnson looks strong but those players have just not performed consistently with none of them cracking the top 15 backs so far this year.  As a consequence T2 are actually 2nd lowest scoring at the position, 7 points per week behind the average and over 21 points per week behind the top unit.  This feels like a blip though, I fully expect this unit to have returned to the top half by the end of the year as NFL offences warm up, the Patriots stop getting into shootouts every week and the Jets realise that Bilal Powell is more or less their only weapon on offence.

Their problems at secondary may not correct themselves as automatically however.  Through 4 weeks the returning ability of Adoree Jackson makes him their only succesful option at CB and Landon Collins, a monster last season, has disappointed so far this year putting in only low S2 numbers.  The good news for T2 is that with scores of 11.5, 15.25, 22 and 28.18 the performance of their secondary is trending up as Goodson and Ward start to get their selections right and work that blind bidding for better options.  T2 are consistently amongst the best in the Dbowl at building defences and spotting strong performers early so I am confident this can be turned around.

Offence Average: 95.36 points (6th)
Defence Average: 77.03 points (6th)
Overall Average: 172.39 points (8th)
Record: 1-3 (4th in Peter)


The People’s Republic of the 4th Dynmension: Dynasty of Sadness

Forging Ahead: Running Backs, Receivers (also Secondary but I’m fed up of writing about secondaries already)
Stuck in the Mud: Er… Special Teams?

My prediction for Dbowl champions ahead of the season, the Sadness have had a funny old start to the year.  They’ve scored very well being, on average, the 2nd highest points scorer in the competition yet they are 2-2 after 4 weeks.  Scoring of that kind of calibre should pay off over the course of 13 weeks though and I would be surprised if they didn’t make the playoffs.  Their running backs are really leading the charge for Mangboob’s team as they are the top scoring unit of their type in the league, a frankly silly 7 points better per week than anyone else and 14 points above the average.  Kareem Hunt’s superhuman breakout is a large part of this but with Ezekiel Elliott and Ameer Abdullah on the books too, the Sadness are not just a one-trick pony.  Assuming that Jacquizz Rodgers loses his starting job to Doug Martin the bye weeks could present a problem for Mangboob, however, as he only has Theo Riddick and Shane Vereen backing up his starters.  Having said that, there aren’t many teams in the league for whom bye weeks aren’t a problem though as the RB position is thin for a league playing three starters each week.

The Sadness actually have a complete offence though with their receivers lagging only slightly behind the backs, being the 2nd highest scoring unit so far this year, 8.5 points per week above the average.  This position is only really likely to improve too as Odell Beckham is currently outside the top 20 WRs due to injury and Eli (admittedly, only one of those is going to go away).  Stefon Diggs and Michael Thomas lead the line for the Sadness with the former being the #1 receiver so far this season (how’s that Dez Bryant trade looking, Chris?).  There is strength in-depth here too with Allen Hurns, Pierre Garcon and Ted Ginn all sitting behind the front 3 ready to contribute solid WR4 numbers.  At TE they appear comfortable too as, even with Jordan Reed’s disappointing start to the season, Delanie Walker is still a mid-tier TE1 able to happily cover the position off and put up good numbers.

They also have the best secondary.  Same story as everyone else here really.  Rubbish CBs and really good Safeties.  It’s almost like the CB position is impossible to predict, eh?

So where do the Sadness fall down then?  It’s difficult to pick out a problem area to be honest as, really, the issue is that too many of their other units (LB, D-line, QB) are just at or below average.  The only place they fail to score well is on special teams where the Sadness’ haul of 10.16 points per game is the worst in the league.  Despite both his kicker and punter being miles outside the top 20 at the position, Mangboob is keeping faith with both of them seemingly and this could be a problem as he’s currently giving away 4 points per week to the average team due to this oversight although at least he hasn’t lost any games by that margin so far this year.

Offence Average: 119.25 points (2nd)
Defence Average: 78.48 points (5th)
Overall Average: 197.72 points (2nd)
Record: 2-2 (3rd in Peter)


Dynasore Losers

Forging Ahead: Running Backs, Quarterbacks
Stuck in the Mud: Everything Else

Look, there’s not much point in going into the stats here.  David Slater’s Losers are in full rebuild mode here with their ageing or short contract players being traded away for picks so looking at the numbers tells us nothing.  Let’s instead take a look at the players that the Dynasore Losers have to anchor that rebuild around.

First off, they look set at Quarterback.  I don’t know what happened to Derek Carr in the last two weeks but, long-term, I think he’ll be a good fantasy Quarterback and Jameis Winston is no slouch either though Slater could probably do with Winston not cracking the top 7 this year to keep his renewal price down.  At any rate, there’s no immediate need at this position.

Similarly at RB the building blocks are in place for a decent unit.  Despite both being on the same team, Jordan Howard and Tarik Cohen have very different roles and there’s no reason why both can’t be top 25 at their position at least in a year if the offence is built right.  Behind those two sit Jalen Richard and DeAndre Washington who will, I think, in the next few weeks start to take more workload away from Marshawn Lynch who is starting to look his age after a bit of week 1 and 2 freshness.  Add Christian McCaffrey on top of that and this part of the team should be fine.

Offence Average: 82.53 points (10th)
Defence Average: 54.61 points (10th)
Overall Average: 137.14 points (10th)
Record: 0-4 (5th in Peter)


Champions of the Sun

Forging Ahead: Receivers, Linebackers
Stuck in the Mud: Defensive Line, Secondary

Apart from an inexplicably terrible week 1 performance the former Dbowl champions have looked strong so far this year, led by their receivers and linebackers, both of whom are the top scoring units at their position so far this year.  At WR, the Champions have 7 players in the top 40 and 4 in the top 20, showcasing impressive (and somewhat unexpected) strength in-depth that should see them able to cope with their bye weeks ok.  It would be fair to question whether the performances of the likes of Chris Hogan (TD dependent so far) and Sterling Shepard (a lack of OBJ) can continue but even with a bit of regression from a couple of players they should remain strong to season’s end.

By contrast, the linebacker performance is all about top end with three guys in the top 5 (Clowney, Houston and Mack) and McKinney in the top 20 but then only one more player anywhere in the top 50.  This performance is more likely to drop, both through injury and bye weeks and Clowney’s large number of big plays through 4 weeks.  Max Cubberley will hope to see more from the likes of Anthony Barr, Kiko Alonso and Jamie Collins in the coming weeks to bolster his options at the position.

Really, it’s a good job the linebackers are doing well because the D-line and the secondary have been a disappointment.  After signing Leonard Williams to a decent sized extension this off-season Cubberley will have been hoping the Jets DE could be an every week starter but he only has 6.5 points through 4 weeks.  Combined with Khalil Mack’s off-season re-positioning to LB, the Champions have been left in the lurch and this shows with an average weekly score of only 16.88, good for 9th in the league.  The bright spot for Cubberley is Dante Fowler’s emergence and he must now be an every week starter despite his comparatively low snap count.  The Champions felt confident at DT going into the season with Marcell Dareus, Sheldon Rankins and Maliek Collins but so far only Collins has had any value and Dareus has recently been dropped.  This unit should improve going forward with the addition of Danielle Hunter and the emergence of Dante Fowler and Cubberley will hope it does to take some pressure off his LBs.

The same will be needed from the Champions’ secondary who have scored 20.19 points per game so far this year, 8th in the league and 2.5 points below average.  There are some mitigating factors here however with 3 of the Champions’ 8 starting CBs (PJ Williams, Orlando Scandrick, Josh Norman) so far this year unable to even complete the first half of their games.  The players who have seen out the games haven’t been great either though with none of Reshad Jones, Jahleel Addae or TJ Ward able to put up points at safety.  Cubberley will be hoping that the recently promoted Malik Hooker (#9 safety so far) and the added EJ Gaines and Jason McCourty can help the unit to kick on.

Offence Average: 121.68 points (1st)
Defence Average: 80.16 points (3rd)
Overall Average: 201.84 points (1st)
Record: 3-1 (3rd in Tim)


DynaForOne Firebirds

Forging Ahead: Quarterbacks, Defensive Line, Special Teams
Stuck in the Mud: Secondary

Looking through the Firebirds stats it is apparent how unlucky they are to be 1-3 and bottom of Tim.  They have a number of units performing very well (as well as the ones I’ll cover their receivers are very good too) and even their lesser performing units are largely just below average rather than bad (with one exception).

The place to start here is at Quarterback where Neil Hawke has rolled out Russell Wilson every week except one and, despite the Seahawks’ struggles, done very well out of it.  After a slow start (which saw Wilson dropped for Big Phil Rivers) the diminutive QB has racked up the points with over 60 in the last two weeks, good enough for #3 at the position behind Tom Brady and Alex(!) Smith(!!!!).  With Rivers and Dak Prescott backing up Wilson, the Birds are set for a few years here.

Perhaps more surprising is the Firebirds’ performance at receiver where they rank 3rd behind only the Champions of the Sun and the Dynasty of Sadness.  Sure, you would expect a unit led by Julio Jones and Rob Gronkowski to be good but, whilst Gronk’s been Gronking, Jones is only the #31 WR so far.  The real star has been not-quite-dead-yet Larry Fitzgerald, who is lurking in the top 10 but beyond that Hawke’s receivers are doing fine but not spectacularly.  It all goes to show the difference that Gronkowski makes as a TE with his superiority at the position helping to take the burden away from everyone else.  A quick note here on Neil’s special teams unit who are the best in the league.  With the #2 kicker and the #6 punter the points are going on the board every week at a steady rate.  Take note Mangboob!

The real weakness in the Firebirds’ team is the secondary, the lowest scoring in the Dbowl and giving away 2 points to the secondary in 9th and 5.5 points to the average secondary.  The worst part of this is the Hawke actually has good players at the position.  Darius Slay and Desmond Trufant are the #3 and #16 CBs and Devin McCourty is the #16 safety.  True, he has no good second option at safety but perhaps this a case of too much tinkering.  If Hawke keeps it simple from now and plays his top-scoring guys every week there should be an improvement here.


Offence Average: 114.80 points (3rd)
Defence Average: 67.63 points (8th)
Overall Average: 182.43 points (5th)
Record: 1-3 (5th in Tim)


Kelkowski Don’t Play By No Dyna Rules

Forging Ahead: Sorry lads…
Stuck in the Mud: Running backs, receivers, linebackers

Ooof, talk about first to worst.  Well, you can’t quite talk about that thanks to the Dynasore Losers epic deconstruction of what can be considered a “team” but the season is not going well for Kelkowski.  As such I have nothing positive to say.  Their D-line and Quarterbacks are both 4th in the league but every other unit is below average and, in the case of their running backs, worst in the league.  Scoring an incredible 18.13 points per week, Kelkowski’s ball-movers are giving away an almost unbelievable 14.5 points per game to the average Dbowl running attack.  Speaking as someone who owns both DeMarco Murray and Derrick Henry in the Cbowl I can see where a lot of this problem is coming from but Mark Ingram has not been doing the business either and behind those three is only the walking corpse of Chris Johnson and whatever a TJ Yeldon is.  Boys, I know that trading is for suckers but it may be time to start dusting off the fax machine and finding some way to address this problem.

Although, maybe that would just be a waste of time.  After all, Kelkowski’s receivers are only one place better, being 9th in the league and only .7 points per week ahead of the Dynasore Losers.  At least they’re only giving away 6 points per week to the average team here though so that’s an improvement right?  When your top four scoring receivers are Devin Funchess, Rishard Matthews, Travis Benjamin and Jaron Brown though you are going to have a problem.  To be fair to them Kelkowski have hit a perfect storm of under performance so far this year.  Randall Cobb, Jeremy Maclin and Terelle Pryor have all been major disappointments in one way or another and find themselves all outside the top 40 receivers.  At this point though, would anyone like to bet that they will improve?  I’m not sure I would.

This roast now concludes with a look at Kelkowski’s linebackers, traditionally a strong unit for them.  Although bad (4th worst in the league and giving 6 points away to the average) this area is not as disastrous as the two above.  Kwon Alexander and Dont’a Hightower has been missing most of the year and that’s two big names to be without.  Behind them both Terrell Suggs and recently acquired Nick Vigil are performing at LB2 levels and there are a cadre of guys lower than that who have been ok but nothing more.  Really the team is suffering from a lack of high impact players at the position and this should get better when Alexander and Hightower are back and now Nick Vigil’s apparent 10-tackle-floor can kick in.

Offence Average: 85.20 points (9th)
Defence Average: 65.66 points (9th)
Overall Average: 150.86 points (9th)
Record: 1-3 (4th in Tim)


Live Free or Dyna Hard

Forging Ahead: Running backs, Linebackers
Stuck in the Mud: Defensive Line

In many ways, DynaHard are the anti-Tamworth Two in that their success comes this year from being at or just above average in most things and not having any real weaknesses.  One of their best units though has been their running backs who are the second highest scoring (albeit still 7 points a week behind Mangboob’s powerhouses).  The resurgent Todd Gurley (#2) leads the way and Chris Braithwaite has a guy in every tier from there down with Ty Montgomery performing as an RB2, Frank Gore as an RB3 and Wendell Smallwood as an RB4.  To cover his bye weeks Chris is going to have to hope that wily vets Jamaal Charles and Marshawn Lynch still have something in the tank but, fitness allowing, Gurley and A. N. Other running back should really be enough to keep up a high level of performance.

Although not performing as well as his running backs, Braithwaite’s linebackers are 3rd in the league and best of the rest behind the elite performances of the Champions of the Sun and the Bombermen (see below).  CJ Mosley, Ryan Kerrigan and Von Miller are all in the top 10 with TJ Watt and Demario Davis also in the top 21.  Continuing to look down the list we find Jatavis Brown and Thomas Davis both putting up decent numbers for bye week cover and this unit should continue at this level, if not improve, to season’s end.  If anything I would expect to see them close the gap on the top 2 rather than sink down into the pack.

As mentioned, there’s not much that DynaHard are bad at but Braithwaite will be disappointed in his defensive line so far this year.  A lot of resources are tied up in JJ Watt and, for understandable reasons, he has not looked anything like his former self so far this year.  That puts the DE production on the shoulders of Ziggy Ansah, Olivier Vernon and rookie Solomon Thomas.  Vernon (in my experience) has always been a slow starter but the signs look good that Ansah is close to a return to form so I expect to see this unit improve from their current 3rd worst position towards the middle of the pack as we go through the year.  There could be problems at DT however where Chris has all his eggs in a Timmy Jernigan-shaped basket, being literally his only player at the position.  I’m sure DynaHard have plans to address this either through trade or free agency but with Jernigan questionable for this week’s game sooner would be better than later!

Offence Average: 112.27 points (4th)
Defence Average: 76.20 points (7th)
Overall Average: 188.47 points (3rd)
Record: 3-1 (1st in Tim)


Dynablaster Bombermen

Forging Ahead: Special Teams, Linebackers
Stuck in the Mud: Quarterbacks

On offence this season the Bombermen have been pulled through by their special teams performance as the rest of their unit has been patchy.  Sam Koch is the #3 punter and Will Lutz is the #6 kicker.  Apparently #6 isn’t good enough for The Commish though because Lutz finds himself on the scrapheap, shunted in favour of the mighty Legatron, the #1 kicker in all of football.  Could the league’s 2nd best special teams unit just have made the move to push them ahead of the Sadness into first place?

On defence it’s the Bombermen’s linebackers who are carrying the team however.  Similarly to the Champions of the Sun’s elite unit however there is a lot resting on Ryan Shazier and Chandler Jones here (the #3 and #4 linebackers).  Outside those 2 only have two more LBs in the top 50 (Zach Brown at 33 and Sean Lee at 49.  The Bombermen need to hope that Shazier and Jones can stay fit (something the former has not been able to do historically) and that rookies Reuben Foster and Carl Lawson can build on the promise they’ve shown so far to become solid contributors as the season goes forward.

Maybe I was wrong.  Maybe the Bombermen are the anti-Tamworth Two because the secret of their success this year seems to be not being worse than 6th in the league at anything and then letting your elite special teams and linebackers carry you.  I’m going to criticize their Quarterbacks a bit though because although they are only 7th in the league they are giving away 3.5 points on the average which is reasonably significant.  It’s hard to be too critical though, you would have thought that going into the season with Matt Ryan as your #1 and Tyrod Taylor as your backup would’ve been fine but so far Matt Ryan is giving you a return more like his 2015 version than the Superbowl one.  Hopefully for the Bombermen he’ll turn that around but in the short-term it may actually be worth looking to Tyrod Taylor’s running floor until he does.

Offence Average: 101.70 points (5th)
Defence Average: 82.36 points (2nd)
Overall Average: 184.06 points (4th)
Record: 3-1 (2nd in Tim)

Peter vs. Tim

The last thing to do before I leave you (probably for another year) is a quick look at how Peter and Tim are doing overall.  Maybe this is the year the gap closes?  The year that Peter can finally match or even surpass Tim?

1 2 3 4
Peter 168.18 171.59 155.381 191.744
Tim 170.784 192.183 194.132 169.023
Winner Tim Tim Tim Peter
Margin 2.60 20.59 38.75 -22.72

Not likely, mate.  TIM FOR LIFE!

MAX’S STAT BLATS! Week 6

Better late than never!  Or maybe not.  I’ll leave that up to you.  In week 4 I took a look at every team’s offensive performance so far in 2016 and compared it to their 2015 performance to look for improvement and decline.  This week I’ll be doing the same with the defense.  To the stats!

2016 Week 1-6 Average vs 2015 Average
Dungeoneers Brees T2 Sadness Losers Champions Firebirds Kelkowski Hard Bombermen
DT/DE -6.31 4.90 -8.94 1.80 -3.83 4.10 1.40 7.85 -5.02 -2.05
LB -0.29 8.69 3.39 -3.05 7.57 -4.63 3.14 -6.71 -1.17 3.46
CB/S 4.13 2.63 3.08 -9.36 -3.03 -9.20 5.86 -3.58 7.45 -1.51
DEF -2.46 16.22 -2.47 -10.61 0.71 -9.73 10.39 -2.44 1.26 -0.10

Defensive Line

Winners: Kelkowski are crushing it on the D-line this year!  Nearly 8 points up on 2015!  Look a bit deeper though and it has, perhaps, some of the qualities of a mirage.  Firstly, JPP and friends are averaging 22.67 points per game, slightly above average for the D-line.  It’s an improvement but it’s a movement from bottom of the pile to mid-table obscurity.  Secondly, that average is propped up by a massive 63 points in week 3 when the ghost of Malik Jackson briefly turned up to spook Ebeneezer Kelkowski.  Across the other 5 weeks they average 14.6 points, a number better only than Pete’s damp paper bag of a D-line.  Despite losing Aaron Donald, the Brees are functioning better than last season too.  Part of this is due to replacing the best DT in fantasy football with the second best in Fletcher Cox but Michael Bennett and Cameron Jordan are both solid producers too.

Losers: Oh T2, we knew thee well.  After triumphing in the “underwhelming running back” stakes last time out, Goody and Mat show us that they can disappoint on both sides of the ball.  Some of this decline is due to missing pieces (Gerald McCoy and Chandler Jones have been absent much or all of the year) but I think we see an impact of the scoring changes here.  T2 hit big on Kawann Short and Gerald McCoy last season and DTs are probably the group to take the biggest hit from the downgrading of big plays.  Both have scored very well but those 40 point games should be gone now for the most part.  A lot of last year’s big DT scorers have done worse through the start of 2016.  The Dungeoneers d-line is also down 6 points but I don’t think I can kick Pete anymore so let’s leave it at that.

Linebackers

Winners: There are two clear winners in this category, the Brees and the Losers.  Both units were very poor last season so, like Kelkowski’s D-Line, this improvement puts them in the middle of the pack rather than raising them to the top of the charts.  Slatz invested in the position in free agency and the draft with Paul Posluszny and Markus Golden delivering and Deion Jones and Leonard Floyd looking strong through the start of their rookie seasons.  The Brees, meanwhile, seem to have gone for the “2015 Josh Norman” effect and just picked up a player from waivers having a monster season in Lorenzo Alexander.  51 of the 99 points they’ve scored at LB in the last three weeks have been from him.  Improved play from Will Compton and Shaq Barrett is helping but to maintain this improvement they need Alexander to continue playing out of his skin.

Losers: What would Max Cubberley say if you asked him about the decline of his linebackers (4.5 points down on last season).  He’d tell you that they’re still scoring more than anybody else’s linebackers so you can go fuck yourself.  He’d probably also whinge on about injuries and players moving position but lets not give him a platform.  Kelkowski’s overall defensive decline continues here with their linebackers regressing the most out of all the teams (6.7 points down on last season).  Their situation is the reverse of the Losers’ and the Brees’.  Kelkowski’s LBs were among the best in the business last season and this year they’re just… average.  D’Qwell Jackson and Brandon Marshall are the main culprits here and Stephone Anthony’s reduced playing time at strong side LB for the Saints leaves them short a little bit of depth.  Zach Orr is a good wire pickup though who should be able to compensate for that.

Defensive Backs

Winners: Yuk.  Defensive back analysis.  Well, Dyna Hard and the firebirds are both doing better this season than last.  Rodney McLeod was a great pick-up for Chris and Aqib Talib’s 3 INTs so far this year certainly don’t hurt.  Chris’ DBs are comfortably the highest scoring in the league so far this season and his main problem now is the potential for PLOBbage.  With 43 cornerbacks to choose from on any given week, it’s no wonder that Neil is doing well but the PLOBbage is real here.  Trying to predict S and (particularly) CB scoring week on week is far from easy and although Neil has done a good job it must be frustrating to look at your bench every week and see the road not taken.

Losers: The Sadness and the Champions both show an equal decline at the DB spot.  For Cubberley the situation is similar to his LBs.  Despite losing 9 points a game on 2015 the Champions still have the third highest scoring set of DBs in the league so this decline is as much a result of an outlying season of success as anything else.  With Reshad Jones gone for the season now though Maxxxxxx will have to look deep into the waiver wire to try to maintain the pace.  The Sadness, on the other hand, are, by nearly 6 points per game, the worst secondary in the Dbowl.  Their decline is from mediocrity to abject failure.  Looking at the scores of his players for the year to date though you wouldn’t think you were looking at a secondary so adrift from the rest of the field.  To be honest, they’ve scored from disappointing to average every week rather than terribly and this slump is really a result of having no big weeks so far.  A couple of INTs this week could see them pick up and return closer to the average.  DBs, eh?  It’s a funny old game.

Defence

Winners: Although his DB improvement is the best, Neil has improved across the board on defence this season, scoring over 10 points more than last year per game.  At 86.20 points per game, his group is the best in the Dbowl at the moment but the week on week stats show a sharp decline.  In weeks 1-3 the Birds averaged 108 points per game on D.  In weeks 4-6 that number fell to 64 points per game.  He’s had big pieces on bye in each of those weeks but it’s something to keep an eye on.  If I was Neil I would be moving to address the obvious gap at DE in his roster.  Maybe drop a CB or two to make ro… who am I kidding, he’s never going to drop any CBs.  If you think improving by 10 points is impressive, though, look at the Brees!  A 16 point increase!  That takes them to averaging 76 points per game which is… wait… it’s bang average.  Putting aside Pete’s crepe paper D (sorry Pete) the Brees were about that far adrift of everyone else last season.  Really, it would have been more impressive to be so bad two seasons in a row.

Losers: Let’s just check in with Max Cubberley on what he thinks about his defence averaging 10 points fewer than last season.  “Go fuck yourself!”  Thought so.  The Champions are still the second best scoring defence but last week was a low outing from them and this week’s lineup has a few too many waiver wire pickups for my liking.  We’re not too far off a week where Cubberley starts 4 Texans’ linebackers and that can’t be good for anyone.  The Sadness are the other team to have lost 10 points off their average.  Most of that is their secondary, as discussed, though and there is some cause for optimism that those numbers could improve over the season.  Despite Linval Joseph’s monster season so far the Sadness only show a 2 point improvement on the D-Line though and there is room for improvement here.  Mangboob’s DEs are not inspiring and a little trade magic could really help him to improve those numbers and make a playoff push in Peter.

Overall

Winners: It will come as no surprise to anyone that the Bombermen are the big improvement on last season, averaging 24 points more per game than last season’s disappointing results.  You’ll have seen that they were conspicuous by their absence in today’s report and, indeed, their defence is operating at a 0.1 loss on last year.  All of this is offensive improvement and it looks like it has the legs to go all season.  The Sadness are the other big improvement, nearly 15 points up on last year.  This is despite giving 10 points away per game from their receivers and it shows the difference that a certified stud like Zeke Elliot can make.

Losers: Last season’s hot ticket, the Champions of the Sun, are back scrapping with everyone else this year, down 10 points on defence and 6 points on offence.  Despite all of this they’re still scoring well but some thinness at RB and secondary is coming home to roost and they’re now in a position of relying on Trevor Siemian week on week for production.  After them, Tamworth Two are having a ‘mare this season, giving away 8 points a game.  LeSean McCoy is keeping their running game above water on his own and it’s really just the D-line and special teams (!) that account for the decline.


Weekly Stats

TABLES!

Don't Look Blat In Anger
Don’t Look Blat In Anger


Peter vs. Tim Watch

Week 1: Peter (average) 179.68 vs Tim (average) 192.14.  Tim wins.  1-0 to Tim (victory margin 12.46)
Week 2: Peter (average) 184.04 vs Tim (average) 200.91.  Tim wins.  2-0 to Tim (victory margin 16.87)
Week 3: Peter (average) 192.11 vs Tim (average) 212.54  Tim wins.  3-0 to Tim (victory margin 20.43)
Week 4: Peter (average) 175.27 vs Tim (average) 198.18  Tim wins.  4-0 to Tim (victory margin 22.91)
Week 5: Peter (average) 177.50 vs Tim (average) 176.66  PETER WINS.  4-1 to Tim (victory margin 0.84)
Week 6: Peter (average) 170.47 vs Tim (average) 174.70  Sanity is restored, Tim wins.  5-1 to Tim (victory margin 4.23)

Season to Date: Peter (average) 179.85 vs Tim (average) 192.52. Tim leads (margin 12.68)

DELO Ratings 2016

Maybe you’re familiar with Elo ratings, but I’m going to assume you’re not. Arpad Elo was a Hungarian-born American physics professor who developed a ratings system, originally for chess but later applied to all sorts of sports, including American football, baseball and snooker. It’s now used frequently (in a variety of adapted versions) on fivethirtyeight.com to try to find the best team in history in various sports, amongst other things.

The idea is relatively simple, but the methodology is much more complicated. All competitors, be they individuals or teams, start with a ranking – often 1000 or 1500 – and each time they play they add on points or lose points, according to the result. That can just be a win/lose/draw based metric or it can get much more complex to try to account for home field advantage and scale of victory. If the team you beat is very good you score lots of points, if they’re not so good, fewer points. Likewise, lose a game and lose points based on the skill of the opposition – the better the opposition, the fewer points lost.

In order to try to compare eras, previous results from previous years/decades/whatever have to be removed in some manner so the rating only applies to the team of now and ensure they’re not getting false credit for performance too far in the past. Another adjustment 538 have mentioned they make is between seasons. In all sports, the team line-ups change one year to the next. In American sports, the system is set up to try to even the playing field, with the worst teams getting to draft players first. As this is supposed to be a return towards the middle, they adjust their rankings between seasons by reducing above average teams slightly and increasing below average teams slightly so that next season they all start a little closer together.

All this got me thinking, could we develop an Elo system for the Dynabowl? A DELO system, if you will. So I gave it a shot. I’m going to outline my methodology, share my results, and the provide a means to download my source spreadsheet so you (YES, YOU!) can see if you can improve on it.

The first problem I encountered was that Elo is specifically designed for situations where two teams are playing each other with the result changing a teams ranking. While that does occur in fantasy football, the teams aren’t directly influencing each other’s performance. If the top scoring team one week played the second top scoring team, it would be harsh to penalise the second team DELO points when they would have won any other game.

What i decided to do was look at a teams scored in comparison to the weekly average score achieved. If you beat the weekly average your rating goes up. If you drop below the weekly average your rating goes down. I also (pretty much arbitrarily) decided to exclude the top and bottom scores each week from the average. This was a gut based decision where I felt one or other of the numbers being an outlier could sway the overall average too much in one direction or the other so I felt it better to take the middle 8 scores and average them. This may be the wrong approach – I didn’t check it against an average of all 10 – but it’s the one I decided to take and I think I made a working system in the end. You may decide otherwise.

The next step to decide was how to calculate the points. I decided, again arbitrarily, to start every team with 1000 points. It felt like a high enough total that I could get some big enough variation, and it felt in keeping with the Elo rankings I’d seen produced elsewhere.

So how many points should get added on or taken away? The obvious answer is however many points above or below average the team scored that week. However, I needed to reflect the way Elo works. As I said, with Elo you get more credit for beating a good team than a bad team and so on. Here I thought that if a team has a lower DELO rating than average and scores well it should get ‘extra credit’, while a poor team scoring poorly shouldn’t be penalised as much as a good team performing badly.

This led me to produce a weighting spread. I said that if a team has a DELO between 950 and 1050 whatever their points difference from average gets added or subtracted at a rate of 100% (i.e. if you were 10 points above average you would get 10 points x 100% added to your DELO. If you start at 1000, your DELO would go up to 1010). The scale then was for every 100 points further away from this central spread you got credited with 10% more or less points. Another example: A team has a DELO of 800, falling in the 750-850 bracket. If this team scores 10 points above average, their DELO would go up by 10 x 120% = 12 points. However, if they scored 10 below average it would only go down by 10 x 80% = 8 points. So a bad team gets more credit for performing well than they lose for performing badly. And vice versa.

Finally, I decided I needed to perform the same between-season adjustment to bring teams back to closer to the 1000 starting point. At first I moved teams 10% closer, but then decided this wasn’t enough so moved it to 20%, which seemed to work. Again, it’s pretty arbitrary, but I’m trying to make a system that seems to represent team skill pretty accurately and this seemed to work. So what do I mean by moving teams 20% closer to 1000 points? I mean if a team had 1100 points at the end of the season, they would lose 100 x 20% = 20 points from their total and begin the next season at 1080. Each team would stay in the same order, but teams with a bigger lead over others would lose more points and the field would close up again, pending the next season’s battle commencement.

Now, I said finally, but there is a final, final step I made, but I applied this later, after I decided the system wasn’t working properly. Before that, I was still pretty happy, but I needed to leave it for a while and come back with a fresh mind. When I did, I decided that, despite the intra-season adjustment, not every team quite matched up by the end of the season to where their talent seemed to lie. I thought some more about 538’s Elo system for eras of sports and how they had to be removing old activity from the ranking to make sure they were appropriately evaluating the current team and I realised my rankings still included too much residual effect. I played around with some options until I found one that appeared to work.

I hit upon a formula which removed half the ranking points earned (or lost) in the same week of the previous year. Again, this feels arbitrary, but again it seems to reach the point where teams are fairly evaluated for their most recent performances. Specifically, their most recent season long performances (i.e. 16 games).

So what does all this show? Here’s a table:

2014 2015
Low Week High Week Final Low Week High Week Final
East Flanders Flahutes 754 16 998 2 754 724 6 799 1 760
Here Comes The Brees 873 16 1021 5 873 760 15 928 7 793
Tamworth Two 968 10 1100 6 976 926 5 1106 14 1087
The 4th Dynmension: Dynasty of Sadness 739 14 953 1 782 836 7 922 14 856
Dynasore Losers 988 1 1185 12 1156 885 14 1149 3 905
DynaForOne Firebirds 907 4 1254 16 1254 1021 16 1255 1 1021
Dynablaster Bombermen 967 9 1041 12 1021 903 12 1065 4 997
Champions of the Sun 1000 6 1149 14 1144 1120 1 1395 16 1395
Kelkowski Don’t Play By No Dyna Rules 1040 1 1166 8 1161 1022 4 1121 14 1049
Dyna Hard 1005 2 1126 11 1086 1087 6 1280 14 1265


Remember, these scores essentially represent the the sum total of performance over the previous 16 weeks. They should kind of link to the total points scored, but when you scored them matters. Scoring a lot of points in a week when, overall, comparatively few points were scored will net you a lot more DELO ranking points than scoring them in a high scoring week. But sure, you could use points scored as a measure. But would that be a fair way of comparing teams across seasons? A high scoring team in a high scoring year may be less impressive than a slightly lower scoring team in a much lower scoring year. This accommodates for that.

And what’s the first thing it tells us? That Max’s winning team in 2015 was quite significantly better than Neil’s winning team in 2014, and even Dyna Hard in 2015 were better than Neil’s team. However, the context that needs to go with that is that Firebirds had a shocking start to 2014. In week 4 they had the second lowest DELO in the league (907), and they recovered from that point. They scored DELO 347 points from week 5 to week 16. Champions of the Sun, by comparison, scored only 198 across the same 12 weeks in 2015. So the Champions were more consistently good. They won 11 regular season games scoring over 3800 points in the process. The 2014 Firebirds, by comparison, snuck into the last playoff slot on the last week of the season with a 7-6 record, scoring 3480 points, before producing an incredible post-season. In fact, the 100 DELO points scored in week 16 is the greatest gain or loss by any team in any given week.

From this, perhaps we can say that the Firebirds produced the most dominant stretch, but for the season as a whole, Champions of the Sun were the better team.

Tune in next time for a breakdown of Offensive, Defensive and Special Teams DELO!

Access the file of data HERE!.