Tag: stat attack

Championship Game Statistics

It’s the middle of the season, so what better time to look back at championships past and see if there’s anything remotely interesting from a statistical point of view. And failing that, find some boring things from a statistical point of view to share.

We’ve all seen the records, of course, so there’s no need to regurgitate the results. Instead, let’s look at different numbers. Like, do teams score more points in the final now?

Errr…. No…
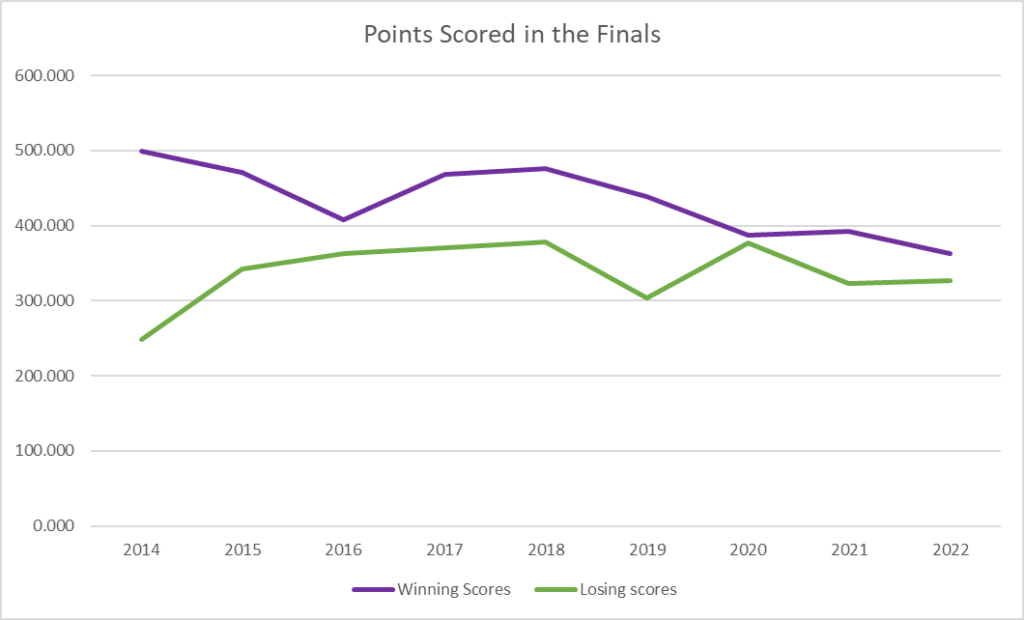
Teams that win the final are scoring less, while teams that lose the final are scoring… incredibly consistently (if we ignore the Brees in 2014). It’s good news for excitement – there’s only been one comeback victory (Dyna Hard, 2017) but at least there are closer matches. The second legs of the last three finals – 2020-2022 – have all been won by the team that lost the first leg, after both legs were won by the same team in five of the first 6 finals.

But how about the split of total points across the two legs?
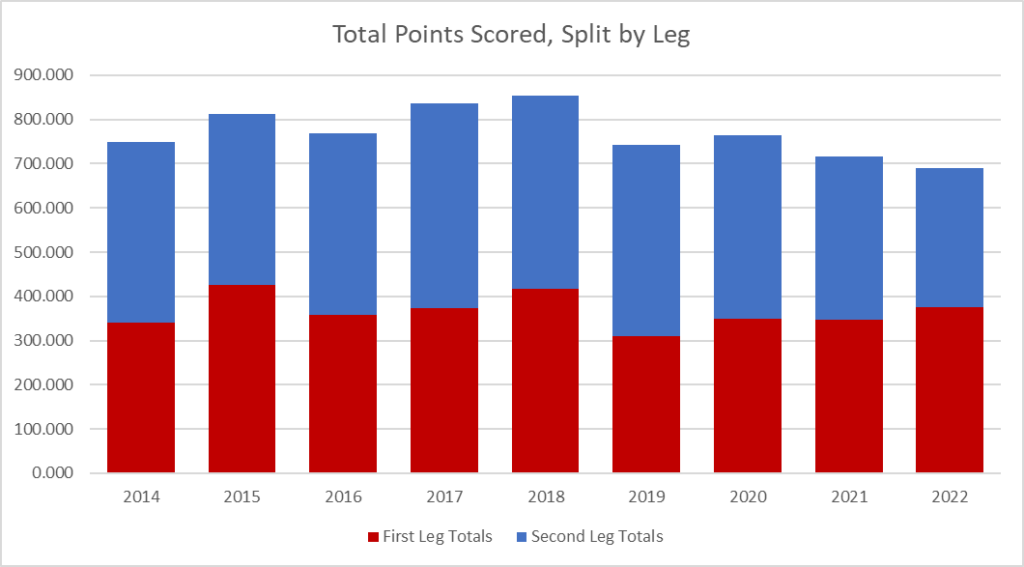
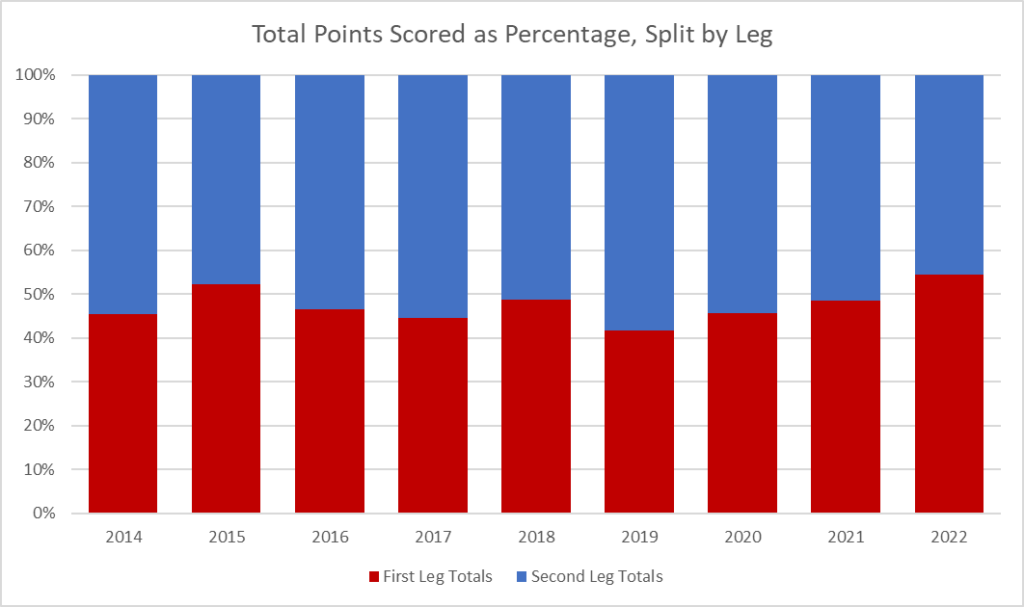
Only two of the nine finals have had more points scored in the first leg than the second. Rather than getting used to each other and neutralising each others attacks, it seems that familiarity breeds explosive offense and an eye for the opponents defensive weaknesses. Or maybe that was a conclusion we could draw if these were actual teams actually facing each other, rather than random players unaware of the importance of their performance in the Dynabowl world.

We can also see, in the top chart, that total points rose to 2018 and have been falling since then. Someone who cares more would probably go back and check the scoring changes we put in place to see if they align.

I can be bothered to do one quick check though. There’s a ranked list of total points scored, per team, per season. Because there’s been an extra game since 2021, we can’t quite compare like for like, but for total points scored to the end of week 16, 9 of the top 20 team seasons have been after 2018, while 11 of the bottom 20 seasons have come in the same period.

Given there were five seasons in the ‘high scoring finals period’ (2014-2018) and only 4 since, this might indicate a slight drop in scoring overall. Especially as the 6 worst seasons were all between 2020 and 2022.

So there we have it – finals are more exciting (CLOSER GAMES) and less exciting (FEWER POINTS) than ever!

Seeding! Does it matter?

What I mean by that is, are the higher seeds more likely to win the title? Let’s take a look…

NB: Third/Fourth determined by third place playoffs

I’m kind of astonished that no one has looked at this before. The abject failure of the number 2 seed to do anything notable at any point is pretty crazy. It took until 2022 for the second seed to win a 2-game match-up (ie the final or 3rd place playoff). The first seed dominance of the past 4 years is also a surprise. In fact, the first seed has always won the 2-game match-up, and in 7 of those 9 years that has been against the number 2 seed.

The run of wins by number 3 seeds also seems like a bit of a surprise. However, in 2016, Kelkowski held the same record as the #1 seed Bombermen (and the #4 seed Hard), in 2017 Dyna Hard were a game behind the #1 seed Hurricanes (then Firebirds), but were league top scorers, 50 points ahead of the #1 seed, while in 2018 the number one seeds were the 13-0 Dyna Hard, who were destined to fail.

Just out of curiosity, I assigned 3 points for a win, 2 for runner-up, 1 for third and 0 for 4th. The number 1 seed gets 19 points, #2 gets 7, #3 17 and the fourth seed gets 11 points. That should really put things in perspective. Idle speculation and shit-stirring, but the top two seeds go to the winners of Peter and Tim. Guess what, 7 out of 9 #1 seeds have come from Tim, bookended by Peter (Losers in 2014, Brees in 2022).

Red for Peter, blue for Tim

Using the patented 3 for a win, 2 for runner-up, 1 for third scoring system, Tim clocks in with 33 points while Peter only racks up 21 across the nine years, but then with only two titles to show for it – both coming in years when the division managed to send 3 teams to the playoffs – that’s probably to be expected.

So back to the exam question – does seeding matter? Only in so much as the second seed was usually from Peter and they usually lost. What matters most is that the team come from Tim.

Double Hundreds

3 teams have scored at least 200 in both legs of the final, the Hurricanes (né Firebirds) in 2014, Champions in 2015 and the Dungeoneers in 2018. No teams have won the title without scoring 200 in at least one leg (though the Champions really pushed that in 2020, scoring 200.145 in the second leg), while only one losing team has managed to score 200 or more in a single leg of the final (the Tamworth Two in that same final against the Champions in 2020).

Regular Season Results Between Finalists

Every year, every team will play every other team at least once. Twice if they are in the same conference, once in the other conference, though since 2021 teams have had a second game against one team from the other conference.

The table below shows the match-ups in the final and the regular season record between the two teams.

Only once has the team winning the final not beaten their opponents at least once in the regular season. That came in 2019 when the Bombermen used the playoffs as a revenge tour. Having gone 11-2 in the regular season they beat Tamworth Two in the playoff semi-final before knocking off the Dungeoneers in the final – those were the only two teams to beat them during the regular season. Is this more impressive than Dyna Hard going 13-0 and then losing the playoff semi-final in 2018? Almost certainly.

What Can We Learn?

Want to win a title? If you make the playoffs, ideally be the first seed and, if not, be the third seed. Try not to be in Peter and make sure you beat your opponent at least once during the regular season, and score 200 in at least one game week.

Fun Facts About The 2017 Chatterbowl

The following things are all facts of various kinds from the 2017 Chatterbowl, or Chatterbowl history to date.

  • Three of the previous Chatterbowl Winners scored more points in the final than the the two 2017 Finalists scored, put together (112)
  • Every team has now made the playoffs at least once. The last to join the list were Spunky Beans (Ian Kulkowski) and Martysaurus Sex (Jay Kelly)
  • Every score between 39 and 133 (inclusive) has now been scored at least once
  • The three GMs to have scored the most points are David Slater (8289 in 96 games), Ben Hendy (8280 in 95 games) and Dan Sayles (8276 in 96 games) – 13 points covering those top 3
  • The top 4 players for average points per games have not played all 6 seasons to date (Chris Braithwaite, Dan Smith, Pete Conaghan and James Goodson)
  • Dan Sayles has longest playoff streak (and it’s still active), making the playoffs every year from 2013 to 2017 (5)
  • Other top playoff teams (Total/Active Streak in brackets), Ben Hendy (5/4), David Slater (4/0), Mat Ward (4/4)
  • Mat Ward is the only person to have won 6 games against another GM and not lost to them (he is 6-0 vs Dan Sayles, which is quite remarkable given Sayles’ consistency)
  • No one else has more than 4 wins without also suffering a defeat against that GM
  • Ben Hendy has scored a century in the highest percentage of his matches (28.8%, 23/80 – data excludes 2012, which had 12 teams). Second is Ben Archer (28.1%, 9/32), and third are Max Cubberley and James Goodson (27.5%, 22/80)
  • Dan Smith has been on the receiving end of the most centuries (27.1%, 13/48), Jay Kelly is in second (26.3%, 21/80), while third is split between Ben Archer, Chris Braithwaite, Max Cubberley, Pete Conaghan and Phillip Malcolm (25.0%)
  • 2017 had the lowest scoring average of all seasons of the Chatterbowl to date
    • 2012 – 86.26 – 1 week averaging less than 80 points
    • 2013 – 85.34 – 4 weeks
    • 2014 – 83.13 – 4 weeks
    • 2015 – 84.40 – 2 weeks
    • 2016 – 83.08 – 4 weeks
    • 2017 – 78.85 – 12 weeks
  • The average score put up by Chatterbowl teams in every single week in 2017 was lower than the average score in that week in the combined average for the previous 5 years
    • I realise I have phrased this confusingly – take the average score that every team got in week one of the previous 5 seasons – the average in week one 2017 was less than this. The same goes for week two, week three, etc and so on.
  • The total number of centuries scored in 2017 was 18. This compares to 32 in 2013, 26 in 2014, 25 in 2015 and 28 in 2016.
  • Week 9 of 2017 was the first ever week in which no team registered a century
  • 3 teams failed to register a century in any week of the 2017 season (Chris Braithwaite, David Slater, Jamie Blair)
    • This has happened 3 times before – Phillip Malcolm 2013, Chris Braithwaite 2015, Chris Hill 2015
  • Teams that made the playoffs in 2017 outscored teams who didn’t make the playoffs 85.08 to 72.63, a difference of 12.45
    • The only bigger gap was in 2013 – 17.61 – 94.15 to 76.54
    • The third biggest gap on the list was 8.63 in 2015 (88.71 to 80.09)
  • The top 3 scorers in the 2017 Chatterbowl regular season were separated by 5 points – Mat Ward (1186), Ben Hendy (1185), Neil Hawke (1181). These are the 17th, 18th and 19th top Chatterbowl regular season points totals ever recorded.
    • Chris Braithwaite and David Slater hold all of the top 5 spots in that particular table
  • In the 2017 Chatterbowl Final, 6 of the Andover Anteaters failed to achieve double figures. This is the second time this has occurred (Flutie Flakes – 2013)
  • No player for the Andover Anteaters scored more than 17 points in the Chatterbowl final (Ben Roethlisberger). This is the lowest top-scoring player ever (previous lowest top scoring player, Allen Hurns & Texans DST, 22 points, Brett Favre’s Junk Calls, 2015 final)

2014 DynaBowl Post Season Performance Analysis – Part 2

So last time I looked at scores and consistency. This time, I wanted to kick things off by examing a league of two halves.

The DynaBowl is something new for all of us and had a steep learning curve. While our overall season performance may have been greatly defined by the players bought at auction, in theory each team could have used the waiver wire and trades to improve their team. Granted, injuries may have scuppered some performances so we shouldn’t necessarily expect improvement, but improvement would be good.

So, starting with the overall figures, let’s split the league into the first 8 and last 8 games of the year and see who got better and who got worse…

First 8 Games Last 8 Games Change % Change
DynaForOne Firebirds 173.794 214.472 40.678 23.4%
Dynablaster Bombermen 170.827 184.841 14.014 8.2%
Champions of the Sun 180.165 193.558 13.393 7.4%
The 4th Dynmension: Dynasty of Sadness 154.278 163.758 9.480 6.1%
East Flanders Flahutes 155.222 161.123 5.901 3.8%
Here Comes The Brees 166.783 168.378 1.594 1.0%
Dynasore Losers 188.170 188.431 0.261 0.1%
Dyna Hard 184.674 180.620 -4.054 -2.2%
Tamworth Two 180.094 170.903 -9.192 -5.1%
Kelkowski Don’t Play By No Dyna Rules 195.506 181.791 -13.714 -7.0%

It’s no surprise, after what was looked at last time, to see DFO at the top of the list. A 40 point per game improvement from one half of the year to the next is pretty extraordinary and shows how the title was won.

It’s interesting how the next 4 teams are not playoff teams though. You could argue that they had the most improving to do, but Champions of the Sun improved from the 4th highest scoring team across the first half of the year to the 2nd highest scoring team in the second half and still failed to make the leap.

One team that leapt out to me, precisely because they look so anonymous here, is Here Comes The Brees, who registered a 1% rise in scoring despite the majority of their team being the victim of Billy Cole, the running back in Last Boy Scout.

On the flip side, some serious questions may need to be asked in the owners offices at the Tamworth Two and Kelkowski.

Kelkowski and Dynasore Losers are in the bottom 4 and lost in the first round of the playoffs. Coincidence? Maybe.

So now, of course, it’s time to see where the gains and losses were made. Let’s start on offence:

First 8 Games Last 8 Games Change % Change
DynaForOne Firebirds 106.825 124.025 17.200 16.1%
Tamworth Two 84.435 95.791 11.356 13.4%
Champions of the Sun 91.846 100.754 8.908 9.7%
The 4th Dynmension: Dynasty of Sadness 79.972 86.633 6.661 8.3%
East Flanders Flahutes 79.819 80.945 1.126 1.4%
Here Comes The Brees 80.974 77.884 -3.090 -3.8%
Dynablaster Bombermen 94.343 87.516 -6.826 -7.2%
Dynasore Losers 106.049 98.144 -7.905 -7.5%
Dyna Hard 96.099 85.695 -10.404 -10.8%
Kelkowski Don’t Play By No Dyna Rules 117.528 99.366 -18.161 -15.5%

So pick your own team out and tell the story. That’s what I’m going to do.

I know that the Bombermen suffered injuries to Ellington, Bernard and AJ Green, while also trading FHTWMIJ to Kelkowski and so the reduction in average points is explicable. And given we were second in terms of increased performance through the year, we must have hit big on defence. Unless it was on special teams. But seriously, it was on defence…

First 8 Games Last 8 Games Change % Change
DynaForOne Firebirds 55.456 77.150 21.694 39.1%
Dynablaster Bombermen 63.994 84.919 20.925 32.7%
Dynasore Losers 68.463 79.250 10.788 15.8%
East Flanders Flahutes 62.606 67.569 4.962 7.9%
Here Comes The Brees 70.750 75.494 4.744 6.7%
Kelkowski Don’t Play By No Dyna Rules 66.988 69.225 2.238 3.3%
Dyna Hard 76.575 78.738 2.162 2.8%
The 4th Dynmension: Dynasty of Sadness 61.431 63.147 1.716 2.8%
Champions of the Sun 78.144 79.681 1.538 2.0%
Tamworth Two 83.444 64.200 -19.244 -23.1%

Everybody got better on defense! Well done everyone.

No, wait. Who’s that down the bottom? The Tamworth Two. They had the second highest increase in offensive performance, gaining 11 points per game in the second half of the season, but then giving away nearly 20 on the defensive side. Tamworth sprinted out to a 2-0 start and looked like the team to beat. Or one of them. But it’s not difficult to see where things went wrong.

On the other side, I am very happy with the improvement on the defence. I drafted the defence really badly, but Dan and I made some really solid moves through the year to gain more than 20 points per game from the unit. Over the second half of the year, the Bombermen defence scored more than 5 points per game more than any other defence, and that was without a JJ Watt, Justin Houston or Cameron Wake defensive star to do the majority of the damage. It turned into a really good all round unit.

Now, special teams. Probably nothing to see here, right?

First 8 Games Last 8 Games Change % Change
Dyna Hard 12.000 16.188 4.188 34.9%
Champions of the Sun 10.175 13.122 2.947 29.0%
Kelkowski Don’t Play By No Dyna Rules 10.991 13.200 2.209 20.1%
DynaForOne Firebirds 11.513 13.297 1.784 15.5%
The 4th Dynmension: Dynasty of Sadness 12.875 13.978 1.103 8.6%
Here Comes The Brees 15.059 15.000 -0.059 -0.4%
Dynablaster Bombermen 12.491 12.406 -0.084 -0.7%
East Flanders Flahutes 12.797 12.609 -0.187 -1.5%
Tamworth Two 12.216 10.911 -1.304 -10.7%
Dynasore Losers 13.659 11.038 -2.621 -19.2%

To be honest, while that setup might have seemed like I was going to have some shocking revelation, I really don’t. There are some numbers up there. The percentages get high, but does that tell us much about special teams? You decide…

Now as a teaser for what’s to come, here’s the same information presented in this and the last post, but for QBs only… First, total points scored:

Max Score Min Score Regular Season Total Playoff Total Full Season Total
Here Comes The Brees 32.800 0.360 311.460 39.100 350.560
Tamworth Two 36.600 6.100 300.760 48.700 349.460
DynaForOne Firebirds 37.120 8.700 267.400 77.100 344.500
Dynasore Losers 30.960 2.720 301.460 28.180 329.640
East Flanders Flahutes 30.280 11.320 257.740 50.520 308.260
Dynablaster Bombermen 31.420 10.040 220.440 69.980 290.420
Kelkowski Don’t Play By No Dyna Rules 29.420 3.860 205.680 68.020 273.700
Champions of the Sun 26.540 7.200 218.140 54.140 272.280
Dyna Hard 30.040 4.640 199.960 40.480 240.440
The 4th Dynmension: Dynasty of Sadness 19.060 0.000 126.920 52.320 179.240

It’s interesting that only two teams had a minimum score of at least 10, and neither made the playoffs, while 3 of the top 4 QBs made the playoffs. Coincidence? Yes.

So how about QB consistancy? Well…

Team Max Consistency Score Min Consistency Score Season (Root Ave) Consistency Total Points
The 4th Dynmension: Dynasty of Sadness 125.50 0.89 5.24 179.24
East Flanders Flahutes 121.30 0.06 5.59 308.26
Champions of the Sun 96.38 0.02 5.87 272.28
Dynablaster Bombermen 176.06 0.33 6.14 290.42
Kelkowski Don’t Play By No Dyna Rules 175.46 0.00 6.42 273.7
Dynasore Losers 319.78 0.34 7.42 329.64
Dyna Hard 225.38 0.35 7.50 240.44
Tamworth Two 247.79 4.33 8.06 349.46
Here Comes The Brees 464.40 1.51 8.13 350.56
DynaForOne Firebirds 243.01 0.24 8.91 344.5

Inconsistent QBs made the playoffs. Must be a boom or bust type thing, I guess.

Finally, a league of 2 halves:

First 8 Games Last 8 Games Change % Change
The 4th Dynmension: Dynasty of Sadness 9.100 13.305 4.205 46.2%
East Flanders Flahutes 18.525 20.008 1.483 8.0%
Dynablaster Bombermen 17.518 18.785 1.268 7.2%
Tamworth Two 21.360 22.323 0.962 4.5%
Kelkowski Don’t Play By No Dyna Rules 17.403 16.810 -0.593 -3.4%
Champions of the Sun 18.753 15.283 -3.470 -18.5%
DynaForOne Firebirds 23.363 19.700 -3.663 -15.7%
Dyna Hard 16.893 13.163 -3.730 -22.1%
Here Comes The Brees 24.955 18.865 -6.090 -24.4%
Dynasore Losers 24.243 16.963 -7.280 -30.0%

Only 4 teams saw an improvement in the second half of the season. Interesting. Obviously the Dynasty of Sadness was helped by Cam getting his mojo back. Unless he didn’t start Cammy-Cam. I don’t know. I know Cam was benched for a bit. Did the Dynasty get the big scoring performances at the end of the season, or was it that he played Cam early in the season when he scored nothing?

Especially interesting that those inconsistent QBs for the playoff teams all regressed in the second half of the year. Obviously couldn’t bring their A game when it mattered and had to be dug out of it by the rest of the team…