This isn’t as good as the others. I am warning you. Heed my warning.
I mean, it’s fine. It’s not as fun or mesmeric as the others, and I don’t think there’s huge amounts of insight to be taken from it either, but hey ho.
Note that dead money is dead money carried over from previous seasons. In-season dead money is factored in as part of the spend on the particular phase of the game the cut player came from…
The same dataset can tell us how many different players have been employed by each team. This doesn’t account for how many times a player may have been picked up, dropped, and picked up again by the same team. Once the player has been on the roster (including practice squad) they count, no matter how long they stay there, or how often they bounce on and off.
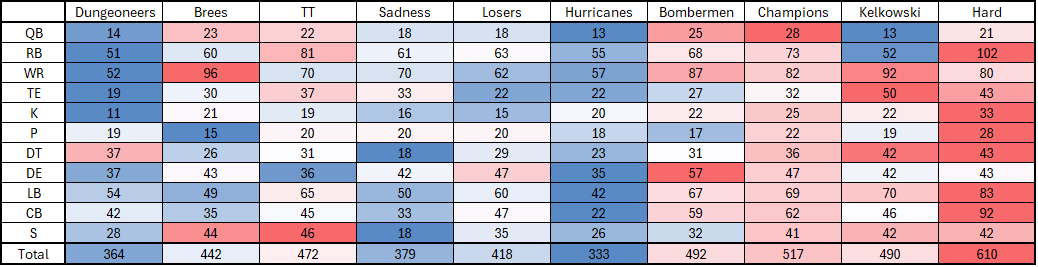
The things I take away from this – the most successful teams are churning their rosters through a lot more different players than the less successful teams – either hoping to stumble across something that sticks, or getting one or two decent games out of someone before moving on.
And, looking at my own team, I don’t think I churned TE or DT much because I had Kittle and Andrews at TE so wasn’t looking for much more, and likewise had Donald at DT for 7 or 8 years. I’ve also not done badly at scoring from safeties either, without having big stars there necessarily, so maybe that explains the lack of churn there.
I am astounded that in 10 years the Dungeoneers have only had 11 kickers, despite needing to cover for bye weeks. Conversely, the Hard have had 92 cornerbacks – 30 more than the Champions, who’ve had the second most, and 70 [SEVENTY] more CBs than the Hurricanes have ever employed. That’s the Hurricanes who currently have 6 CBs on their roster. 92 cornerbacks is 9.2 new cornerbacks that haven’t been on the roster before – every year!!! Insanity.