Chris Braithwaite decided to look at defensive strength and make some projections for the 2022 season:
“Slatz did a write up about team values. You could probably read that if there was a website somewhere. I dunno. But he didn’t include defensive players in that, simply because MFL doesn’t have the data to properly do anything with them given our league settings. So I decided to see what I can do”
DELO Ratings 2016
Maybe you’re familiar with Elo ratings, but I’m going to assume you’re not. Arpad Elo was a Hungarian-born American physics professor who developed a ratings system, originally for chess but later applied to all sorts of sports, including American football, baseball and snooker. It’s now used frequently (in a variety of adapted versions) on fivethirtyeight.com to try to find the best team in history in various sports, amongst other things.
The idea is relatively simple, but the methodology is much more complicated. All competitors, be they individuals or teams, start with a ranking – often 1000 or 1500 – and each time they play they add on points or lose points, according to the result. That can just be a win/lose/draw based metric or it can get much more complex to try to account for home field advantage and scale of victory. If the team you beat is very good you score lots of points, if they’re not so good, fewer points. Likewise, lose a game and lose points based on the skill of the opposition – the better the opposition, the fewer points lost.
In order to try to compare eras, previous results from previous years/decades/whatever have to be removed in some manner so the rating only applies to the team of now and ensure they’re not getting false credit for performance too far in the past. Another adjustment 538 have mentioned they make is between seasons. In all sports, the team line-ups change one year to the next. In American sports, the system is set up to try to even the playing field, with the worst teams getting to draft players first. As this is supposed to be a return towards the middle, they adjust their rankings between seasons by reducing above average teams slightly and increasing below average teams slightly so that next season they all start a little closer together.
All this got me thinking, could we develop an Elo system for the Dynabowl? A DELO system, if you will. So I gave it a shot. I’m going to outline my methodology, share my results, and the provide a means to download my source spreadsheet so you (YES, YOU!) can see if you can improve on it.
The first problem I encountered was that Elo is specifically designed for situations where two teams are playing each other with the result changing a teams ranking. While that does occur in fantasy football, the teams aren’t directly influencing each other’s performance. If the top scoring team one week played the second top scoring team, it would be harsh to penalise the second team DELO points when they would have won any other game.
What i decided to do was look at a teams scored in comparison to the weekly average score achieved. If you beat the weekly average your rating goes up. If you drop below the weekly average your rating goes down. I also (pretty much arbitrarily) decided to exclude the top and bottom scores each week from the average. This was a gut based decision where I felt one or other of the numbers being an outlier could sway the overall average too much in one direction or the other so I felt it better to take the middle 8 scores and average them. This may be the wrong approach – I didn’t check it against an average of all 10 – but it’s the one I decided to take and I think I made a working system in the end. You may decide otherwise.
The next step to decide was how to calculate the points. I decided, again arbitrarily, to start every team with 1000 points. It felt like a high enough total that I could get some big enough variation, and it felt in keeping with the Elo rankings I’d seen produced elsewhere.
So how many points should get added on or taken away? The obvious answer is however many points above or below average the team scored that week. However, I needed to reflect the way Elo works. As I said, with Elo you get more credit for beating a good team than a bad team and so on. Here I thought that if a team has a lower DELO rating than average and scores well it should get ‘extra credit’, while a poor team scoring poorly shouldn’t be penalised as much as a good team performing badly.
This led me to produce a weighting spread. I said that if a team has a DELO between 950 and 1050 whatever their points difference from average gets added or subtracted at a rate of 100% (i.e. if you were 10 points above average you would get 10 points x 100% added to your DELO. If you start at 1000, your DELO would go up to 1010). The scale then was for every 100 points further away from this central spread you got credited with 10% more or less points. Another example: A team has a DELO of 800, falling in the 750-850 bracket. If this team scores 10 points above average, their DELO would go up by 10 x 120% = 12 points. However, if they scored 10 below average it would only go down by 10 x 80% = 8 points. So a bad team gets more credit for performing well than they lose for performing badly. And vice versa.
Finally, I decided I needed to perform the same between-season adjustment to bring teams back to closer to the 1000 starting point. At first I moved teams 10% closer, but then decided this wasn’t enough so moved it to 20%, which seemed to work. Again, it’s pretty arbitrary, but I’m trying to make a system that seems to represent team skill pretty accurately and this seemed to work. So what do I mean by moving teams 20% closer to 1000 points? I mean if a team had 1100 points at the end of the season, they would lose 100 x 20% = 20 points from their total and begin the next season at 1080. Each team would stay in the same order, but teams with a bigger lead over others would lose more points and the field would close up again, pending the next season’s battle commencement.
Now, I said finally, but there is a final, final step I made, but I applied this later, after I decided the system wasn’t working properly. Before that, I was still pretty happy, but I needed to leave it for a while and come back with a fresh mind. When I did, I decided that, despite the intra-season adjustment, not every team quite matched up by the end of the season to where their talent seemed to lie. I thought some more about 538’s Elo system for eras of sports and how they had to be removing old activity from the ranking to make sure they were appropriately evaluating the current team and I realised my rankings still included too much residual effect. I played around with some options until I found one that appeared to work.
I hit upon a formula which removed half the ranking points earned (or lost) in the same week of the previous year. Again, this feels arbitrary, but again it seems to reach the point where teams are fairly evaluated for their most recent performances. Specifically, their most recent season long performances (i.e. 16 games).
So what does all this show? Here’s a table:
| 2014 | 2015 | |||||||||
| Low | Week | High | Week | Final | Low | Week | High | Week | Final | |
| East Flanders Flahutes | 754 | 16 | 998 | 2 | 754 | 724 | 6 | 799 | 1 | 760 |
| Here Comes The Brees | 873 | 16 | 1021 | 5 | 873 | 760 | 15 | 928 | 7 | 793 |
| Tamworth Two | 968 | 10 | 1100 | 6 | 976 | 926 | 5 | 1106 | 14 | 1087 |
| The 4th Dynmension: Dynasty of Sadness | 739 | 14 | 953 | 1 | 782 | 836 | 7 | 922 | 14 | 856 |
| Dynasore Losers | 988 | 1 | 1185 | 12 | 1156 | 885 | 14 | 1149 | 3 | 905 |
| DynaForOne Firebirds | 907 | 4 | 1254 | 16 | 1254 | 1021 | 16 | 1255 | 1 | 1021 |
| Dynablaster Bombermen | 967 | 9 | 1041 | 12 | 1021 | 903 | 12 | 1065 | 4 | 997 |
| Champions of the Sun | 1000 | 6 | 1149 | 14 | 1144 | 1120 | 1 | 1395 | 16 | 1395 |
| Kelkowski Don’t Play By No Dyna Rules | 1040 | 1 | 1166 | 8 | 1161 | 1022 | 4 | 1121 | 14 | 1049 |
| Dyna Hard | 1005 | 2 | 1126 | 11 | 1086 | 1087 | 6 | 1280 | 14 | 1265 |
Remember, these scores essentially represent the the sum total of performance over the previous 16 weeks. They should kind of link to the total points scored, but when you scored them matters. Scoring a lot of points in a week when, overall, comparatively few points were scored will net you a lot more DELO ranking points than scoring them in a high scoring week. But sure, you could use points scored as a measure. But would that be a fair way of comparing teams across seasons? A high scoring team in a high scoring year may be less impressive than a slightly lower scoring team in a much lower scoring year. This accommodates for that.
And what’s the first thing it tells us? That Max’s winning team in 2015 was quite significantly better than Neil’s winning team in 2014, and even Dyna Hard in 2015 were better than Neil’s team. However, the context that needs to go with that is that Firebirds had a shocking start to 2014. In week 4 they had the second lowest DELO in the league (907), and they recovered from that point. They scored DELO 347 points from week 5 to week 16. Champions of the Sun, by comparison, scored only 198 across the same 12 weeks in 2015. So the Champions were more consistently good. They won 11 regular season games scoring over 3800 points in the process. The 2014 Firebirds, by comparison, snuck into the last playoff slot on the last week of the season with a 7-6 record, scoring 3480 points, before producing an incredible post-season. In fact, the 100 DELO points scored in week 16 is the greatest gain or loss by any team in any given week.
From this, perhaps we can say that the Firebirds produced the most dominant stretch, but for the season as a whole, Champions of the Sun were the better team.
Tune in next time for a breakdown of Offensive, Defensive and Special Teams DELO!
Access the file of data HERE!.
Dynabowl Rookie Draft versus ADP & IDP
Now that the dust has settled on the Rookie Draft, is it possible to determine who performed best in that draft? Maybe. I have a go at it below.
Methodology
There are no combined Offensive Player and IDP rookie draft rankings for Dynasty leagues that I can find, so I’ve gone to Dynasty League Football’s rankings for both.
I took the Rookie ADP (Average Draft Position) rankings from June 2015 (click on Rookies tab), and the DLF IDP rankings for the defensive rookies. Then I took the Dynabowl draft and ordered it by Offensive and Defensive picks, and compared the data, providing a score based on deviation from ADP/IDP ranking.
For example, Leonard Williams was the first defensive pick in the Dynabowl, but is the 9th rated rookie by IDP, so he would garner a score of -8 for that pick (massive reach). The higher the score, the better. This methodology has many flaws, the biggest being the range of different scoring methods for IDP leagues (the top three rookies here are Linebackers), but provides a baseline in the absence of something better.
Other flaws
This is looking at the draft in a vacuum; no trades are assessed.
Some of the players do not appear in either set of data – should owners be penalised for that? They are not penalised here.
DynaHarder
| Draft Pick | Overall Pick # | Offensive Pick # | Defensive Pick # | Player | ADP Rank | IDP Rank | Difference +/- |
| 1.01 | 1 | 1 | Gurley, Todd STL RB (R) | 2 | -1 | ||
| 2.05 | 15 | 15 | Mariota, Marcus TEN QB (R) | 23 | -8 | ||
| 2.10 | 20 | 20 | Cobb, David TEN RB (R) | 20 | 0 | ||
| 4.01 | 32 | 27 | Lockett, Tyler SEA WR (R) | 27 | 0 | ||
| 4.02 | 33 | 28 | Langford, Jeremy CHI RB (R) | 37 | -9 | ||
| 4.11 | 42 | 32 | McBride, Tre TEN WR (R) | 36 | -4 | ||
| 5.11 | 55 | 38 | Bell, Kenny TBB WR (R) | 33 | 5 | ||
| 6.01 | 56 | 39 | Diggs, Stefon MIN WR (R) | 34 | 5 | ||
| 7.01 | 66 | Pinion, Bradley SFO PN (R) | N/A | ||||
| Total | -12 |
Nothing too egregious here, a slight reach for Mariota and Langford.
Bombermen
| Draft Pick | Overall Pick # | Offensive Pick # | Defensive Pick # | Player | ADP Rank | IDP Rank | Difference +/- |
| 1.05 | 5 | 5 | Gordon, Melvin SDC RB (R) | 3 | 2 | ||
| 2.08 | 18 | 18 | Johnson, David ARI RB(R) | 18 | 0 | ||
| 3.03 | 24 | 23 | Conley, Chris KCC WR (R) | 26 | -3 | ||
| 4.06 | 37 | 31 | Hardy, Justin ATL WR (R) | 31 | 0 | ||
| 4.13 | 44 | 11 | Waynes, Trae MIN CB (R) | N/A | N/A | ||
| 5.09 | 53 | 16 | Ray, Shane DEN LB (R) | 22 | -6 | ||
| 6.02 | 57 | 18 | Jarrett, Grady ATL DT (R) | N/A | N/A | ||
| 6.04 | 59 | 20 | Flowers, Trey NEP DE (R) | N/A | N/A | ||
| 7.06 | 71 | 26 | Ringo, Christian GBP DE (R) | N/A | N/A | ||
| Total | -7 |
Bombermen suffer for going after Cornerbacks, and other ungraded IDPs. This ranking ignores the big win in seizing Gordon at #5.
Dungeoneers
| Draft Pick | Overall Pick # | Offensive Pick # | Defensive Pick # | Player | ADP Rank | IDP Rank | Difference +/- |
| 1.02 | 2 | 2 | Cooper, Amari OAK WR (R) | 1 | 1 | ||
| 1.03 | 3 | 3 | White, Kevin CHI WR (R) | 4 | -1 | ||
| 2.11 | 21 | 21 | Smith, Devin NYJ WR (R) | 24 | -3 | ||
| 4.04 | 35 | 30 | Davis, Mike SFO RB (R) | 28 | 2 | ||
| 5.03 | 47 | 36 | Greene, Rashad JAC WR (R) | 40 | -4 | ||
| 6.03 | 58 | 19 | Dawson, Paul CIN LB (R) | 13 | 6 | ||
| Total | 1 |
Tamworth
| Draft Pick | Overall Pick # | Offensive Pick # | Defensive Pick # | Player | ADP Rank | IDP Rank | Difference +/- |
| 1.04 | 4 | 4 | Parker, DeVante MIA WR (R) | 5 | -1 | ||
| 2.02 | 12 | 12 | Johnson, Duke CLE RB (R) | 15 | -3 | ||
| 3.04 | 25 | 2 | Beasley, Vic ATL DE (R) | 5 | -3 | ||
| 3.05 | 26 | 24 | Smelter, DeAndre SFO WR (R) | 30 | -6 | ||
| 4.03 | 34 | 29 | Artis-Payne, Cameron CAR RB (R) | 32 | -3 | ||
| 4.09 | 40 | 9 | Collins, Landon NYG S (R) | 8 | 1 | ||
| 6.06 | 61 | 22 | Perryman, Denzel SDC LB (R) | 6 | 16 | ||
| 6.07 | 62 | 40 | Williams, Karlos BUF RB (R) | N/A | N/A | ||
| 7.03 | 68 | 44 | Waller, Darren BAL WR (R) | N/A | N/A | ||
| Total | 1 |
Tamworth are bailed out by a big IDP difference on Denzel Perryman – without that it would be much, much worse. However, none of the individual picks reach that much, so a case could be made for Tamworth knowing their man and going after him aggressively.
Kelkowski
| Draft Pick | Overall Pick # | Offensive Pick # | Defensive Pick # | Player | ADP Rank | IDP Rank | Difference +/- |
| 1.07 | 7 | 7 | Yeldon, T.J. JAC RB (R) | 7 | 0 | ||
| 2.07 | 17 | 17 | Funchess, Devin CAR WR (R) | 16 | 1 | ||
| 3.07 | 28 | 4 | Anthony, Stephone NOS LB (R) | 2 | 2 | ||
| 4.07 | 38 | 7 | Gregory, Randy DAL DE (R) | 10 | -3 | ||
| 5.07 | 51 | 15 | Shelton, Danny CLE DT (R) | N/A | N/A | ||
| 7.07 | 72 | 46 | Montgomery, Ty GBP WR(R) | 41 | 5 | ||
| Total | 5 |
Nothing to see here – no huge variation from the ADP, with the exception of taking the nose tackle in the 5th.
Firebirds
| Draft Pick | Overall Pick # | Offensive Pick # | Defensive Pick # | Player | ADP Rank | IDP Rank | Difference +/- |
| 2.01 | 11 | 11 | Green-Beckham, Dorial TEN WR (R) | 8 | 3 | ||
| 3.06 | 27 | 3 | Kendricks, Eric MIN LB(R) | 1 | 2 | ||
| 3.10 | 31 | 26 | Allen, Javorius BAL RB (R) | 22 | 4 | ||
| 4.10 | 41 | 10 | Edwards, Mario OAK DE (R) | 14 | -4 | ||
| 5.10 | 54 | 17 | Anderson, Henry IND DE (R) | 17 | 0 | ||
| 7.10 | 75 | 47 | Petty, Bryce NYJ QB (R) | 46 | 1 | ||
| Total | 6 |
Middle of the pack for the next few guys..
Brees
| Draft Pick | Overall Pick # | Offensive Pick # | Defensive Pick # | Player | ADP Rank | IDP Rank | Difference +/- |
| 1.06 | 6 | 6 | Coleman, Tevin ATL RB(R) | 11 | -5 | ||
| 1.10 | 10 | 10 | Perriman, Breshad BAL WR (R) | 9 | 1 | ||
| 2.06 | 16 | 16 | Dorsett, Phillip IND WR (R) | 13 | 3 | ||
| 2.09 | 19 | 19 | Williams, Maxx BAL TE(R) | 19 | 0 | ||
| 4.05 | 36 | 6 | Thompson, Shaq CAR LB(R) | 7 | -1 | ||
| 6.09 | 64 | 41 | Grayson, Garrett NOS QB (R) | N/A | N/A | ||
| 7.09 | 74 | 28 | Hicks, Jordan PHI LB (R) | 20 | 8 | ||
| Total | 6 |
Champions
| Draft Pick | Overall Pick # | Offensive Pick # | Defensive Pick # | Player | ADP Rank | IDP Rank | Difference +/- |
| 2.04 | 14 | 14 | Ajayi, Jay MIA RB (R) | 14 | 0 | ||
| 3.02 | 23 | 1 | Williams, Leonard NYJ DE (R) | 9 | -8 | ||
| 3.09 | 30 | 5 | Fowler, Dante JAC DE (R) | 4 | 1 | ||
| 5.02 | 46 | 35 | Rawls, Thomas SEA RB (R) | N/A | N/A | ||
| 5.05 | 49 | 13 | McKinney, Benardrick HOU LB (R) | 3 | 10 | ||
| 6.05 | 60 | 21 | Kikaha, Hau’oli NOS LB (R) | 16 | 5 | ||
| 6.1 | 65 | 42 | Pruitt, MyCole MIN TE (R) | N/A | N/A | ||
| 7.05 | 70 | 25 | Bennett, Michael JAC DT (R) | N/A | N/A | ||
| Total | 8 |
Losers
| Draft Pick | Overall Pick # | Offensive Pick # | Defensive Pick # | Player | ADP Rank | IDP Rank | Difference +/- |
| 1.08 | 8 | 8 | Agholor, Nelson PHI WR (R) | 6 | 2 | ||
| 2.03 | 13 | 13 | Winston, Jameis TBB QB (R) | 17 | -4 | ||
| 3.08 | 29 | 25 | Coates, Sammie PIT WR (R) | 25 | 0 | ||
| 4.08 | 39 | 8 | Odighizuwa, Owamagbe NYG DE (R) | 11 | -3 | ||
| 5.08 | 52 | 37 | Walford, Clive OAK TE (R) | 35 | 2 | ||
| 6.08 | 63 | 23 | Ryan, Jake GBP LB (R) | 15 | 8 | ||
| 7.08 | 73 | 27 | Hunter, Danielle MIN DE (R) | 23 | 4 | ||
| Total | 9 |
No picks from outside the equivalent ranking tables, a solid draft.
And the winner is….
Even without considering the Lacy Trade(TM), and the various other pieces picked up in the draft, The Dynasty of Sadness is the clear winner here, with a massive 27 points.
| Draft Pick | Overall Pick # | Offensive Pick # | Defensive Pick # | Player | ADP Rank | IDP Rank | Difference +/- |
| 1.09 | 9 | 9 | Abdullah, Ameer DET RB (R) | 10 | -1 | ||
| 3.01 | 22 | 22 | Strong, Jaelen HOU WR (R) | 12 | 10 | ||
| 4.12 | 43 | 33 | Robinson, Josh IND RB(R) | 29 | 4 | ||
| 5.01 | 45 | 34 | Jones, Matt WAS RB (R) | 21 | 13 | ||
| 5.04 | 48 | 12 | Dupree, Bud PIT LB (R) | 12 | 0 | ||
| 5.06 | 50 | 14 | Armstead, Arik SFO DE(R) | 19 | -5 | ||
| 7.02 | 67 | 43 | Carter, DeAndre BAL WR (R) | N/A | N/A | ||
| 7.04 | 69 | 45 | Zenner, Zach DET RB (R) | 39 | 6 | ||
| Total | 27 |
Big value picks like Strong and Jones, and no major reaches, means that The People’s Republic has won the draft, at least by this dubious and highly suspect methodology. Well done Geoffrey.
What’s A Pick Really Worth? (The Defence)
This is the part Manboob has been waiting for – the safeties (and the rest of the defence). So without further ado, let’s get straight into it…
While it might seem sensible to go deeper and consider the 2nd and 3rd rounds, it’s ultimately too low a contract in the third round and the range of players it brings in makes it a bit of a crap shoot to go that low and hope for anything more useful to arise from it.
Defensive Ends
| Pick | Contract | Rank | Actual Performers | Average | Comparisons | ||
| 1.01 | $20, 4 years | 3 | 2012 2013 2014 |
Elvis Dumervil Justin Tuck Mario Williams |
171.50 145.00 157.75 |
158.1 | J.J. Watt (198.11) |
| Dwight Freeney (161.08) Jared Allen (160.64) Julius Peppers (155.05) |
|||||||
| Tony Brackens (150.48) Terrell Suggs (147.48) Robert Mathis (144.81) |
|||||||
| 1.02 | $19, 4 years | 4 | 2012 2013 2014 |
Cameron Wake Greg Hardy Robert Quinn |
165.75 144.50 155.75 |
155.3 | J.J. Watt (198.11) Dwight Freeney (161.08) Jared Allen (160.64) |
| Julius Peppers (155.05) | |||||||
| Tony Brackens (150.48) Terrell Suggs (147.48) Robert Mathis (144.81) |
|||||||
| 1.03 1.04 1.05 1.06 1.07 |
$18, 4 years $17, 4 years $16, 4 years $15, 4 years $14, 4 years |
5 | 2012 2013 2014 |
John Abraham Muhammed Wilkerson Jerry Hughes |
164.50 138.85 137.50 |
147.0 | Dwight Freeney (161.08) Jared Allen (160.64) Julius Peppers (155.05) Tony Brackens (150.48) |
| Terrell Suggs (147.48) Robert Mathis (144.81) |
|||||||
| Robert Quinn (136.06) Charles Grant (134.71) Will Smith (129.22) |
|||||||
| 1.08 | $13, 4 years | 6 | 2012 2013 2014 |
Antonio Smith Cameron Jordan Everson Griffen |
147.75 138.00 131.75 |
139.2 | Jared Allen (160.64) Julius Peppers (155.05) Tony Brackens (150.48) Terrell Suggs (147.48) Robert Mathis (144.81) |
| Robert Quinn (136.06) Charles Grant (134.71) Will Smith (129.22) Willie McGinest (128.41) |
|||||||
| 1.09 | $12, 4 years | 7 | 2012 2013 2014 |
Carlos Dunlap Chandler Jones Demarcus Ware |
147.15 137.25 130.05 |
138.2 | Jared Allen (160.64) Julius Peppers (155.05) Tony Brackens (150.48) Terrell Suggs (147.48) Robert Mathis (144.81) |
| Robert Quinn (136.06) | |||||||
| Charles Grant (134.71) Will Smith (129.22) Willie McGinest (128.41) |
|||||||
| 1.10 | $11, 4 years | 9 | 2012 2013 2014 |
Michael Bennett Carlos Dunlap Carlos Dunlap |
133.75 132.75 125.50 |
130.7 | Robert Quinn (136.06) Charles Grant (134.71) |
| 2.01 2.02 2.03 2.04 |
$10, 3-4 years $10, 3-4 years $10, 3-4 years $10, 3-4 years |
10 | 2012 2013 2014 |
Jared Allen Jared Allen Calais Campbell |
132.50 130.75 118.80 |
127.4 | Will Smith (129.22) Willie McGinest (128.41) Trent Cole (127.88) Tamba Hali (127.05) Simeon Rice (126.21) Tracy Scroggins (125.9) Alonzo Spellman (125.62) |
| 2.05 2.06 2.07 2.08 2.09 |
$9, 3-4 years $9, 3-4 years $9, 3-4 years $8, 3-4 years $8, 3-4 years |
12 | 2012 2013 2014 |
Mario Williams Osi Umenyiora Chris Clemons |
131.25 124.80 113.75 |
123.3 | Tamba Hali (127.05) Simeon Rice (126.21) Tracy Scroggins (125.9) |
| Alonzo Spellman (125.62) Mario Williams (125.54) Michael Strahan* (122.96) Jevon Kearse (121.85) Elvis Dumervil (121.28) |
|||||||
| Aaron Schobel (115.26) | |||||||
| 2.10 | $7, 3-4 years | 13 | 2012 2013 2014 |
Cameron Jordan Rob Ninkovich Charles Johnson |
130.50 119.25 113.00 |
120.9 | Alonzo Spellman (125.62) Mario Williams (125.54) |
| Michael Strahan* (122.96) Jevon Kearse (121.85) Elvis Dumervil (121.28) |
|||||||
| Aaron Schobel (115.26) Kevin Carter (115.09) Cameron Wake (114.91) Cliff Avril (114.87) |
|||||||
Financially speaking you’d be paying a defensive end more than everyone except Quinn and Watt, so at the very top of the draft you’d be looking for a seriously talented player and any end taken in the first two rounds should be a viable starter over a 4 year period. One thing to consider when taking an end is that this is a position where the best players have good longevity – Peppers, Allen, Suggs, Watt, Freeney are guys who’ve been good since they joined the league and they have been good for a long time since.
Defensive Tackles
| Pick | Contract | Rank | Actual Performers | Average | Comparisons | ||
| 1.01 1.02 1.03 1.04 |
$20, 4 years $19, 4 years $18, 4 years $17, 4 years |
1 | 2012 2013 2014 |
Geno Atkins Kyle Williams Ndamukong Suh |
254.00 204.50 201.50 |
220 | Reggie White (173.41) Chester McGlockton (144.07) D’Marco Farr (135.2) Kevin Williams (135.08) |
| 1.05 | $16, 4 years | 2 | 2012 2013 2014 |
Ndamukong Suh Gerald McCoy Aaron Donald |
197.00 180.25 188.00 |
188.4 | |
| 1.06 1.07 |
$15, 4 years $14, 4 years |
3 | 2012 2013 2014 |
Nick Fairley Nick Fairley Sen’Derrick Marks |
150.25 172.00 177.50 |
166.6 | Reggie White (173.41) |
| 1.08 | $13, 4 years | 4 | 2012 2013 2014 |
Henry Melton Ndamukong Suh Marcel Dareus |
132.50 152.00 166.00 |
150.2 | Chester McGlockton (144.07) D’Marco Farr (135.2) Kevin Williams (135.08) Aaron Donald (133.45) |
| 1.09 | $12, 4 years | 5 | 2012 2013 2014 |
Gerald McCoy Marcel Dareus Gerald McCoy |
132.25 134.00 157.75 |
141.3 | Reggie White (173.41) |
| Chester McGlockton (144.07) | |||||||
| D’Marco Farr (135.2) Kevin Williams (135.08) Aaron Donald (133.45) Cliff Avril (132.05) |
|||||||
| 1.10 | $11, 4 years | 6 | 2012 2013 2014 |
Kyle Williams Jason Hatcher Johnathan Hankins |
132.25 126.75 131.25 |
130.1 | Kevin Williams (135.08) Aaron Donald (133.45) |
| Cliff Avril (132.05) Chandler Jones (131.5) Justin Smith (131.21) John Henderson (129.32) Grant Wistrom (128.28) |
|||||||
| Muhammad Wilkerson (123.74) Warren Sapp* (121.98) |
|||||||
| 2.01 2.02 2.03 2.04 2.05 2.06 2.07 2.08 2.09 |
$10, 3-4 years $10, 3-4 years $10, 3-4 years $10, 3-4 years $9, 3-4 years $9, 3-4 years $9, 3-4 years $8, 3-4 years $8, 3-4 years |
7 | 2012 2013 2014 |
Dwan Edwards Cullen Jenkins Stephen Paea |
112.75 122.00 127.25 |
120.7 | Justin Smith (131.21) John Henderson (129.32) Grant Wistrom (128.28) Muhammed Wilkerson (123.74) |
| Warren Sapp* (121.98) Trevor Pryce (118.57) Corey Simon (118.36) |
|||||||
| Shaun Ellis (117.94) Cameron Jordan (117.91) |
|||||||
| 2.10 | $7, 3-4 years | 8 | 2012 2013 2014 |
Vince Wilfork Sen’Derrick Marks Kyle Williams |
111.00 118.25 121.20 |
116.8 | Trevor Pryce (118.57) Corey Simon (118.36) Shaun Ellis (117.94) Cameron Jordan (117.91) Sheldon Richardson (117.88) Bryant Young (115.77) Tony McCoy (115.1) |
| Vonnie Holliday (113.99) Jim Flanigan (113.97) |
|||||||
There’s a little bit of cross-over between tackles and ends, but basically any pick in the first two rounds would need to be a clear starter over the four years of their contract, even at the back end of the second round. Guys who’ve been at the top of the scoring in recent years don’t feature in the list of rookies, and that suggests that even the best DTs don’t necessarily perform well from their first days in the league. All told, spending even a late second round pick on a DT is going to be a stretch.
Linebackers
| Pick | Contract | Rank | Actual Performers | Average | Comparisons | ||
| 1.01 1.02 |
$20, 4 years $19, 4 years |
4 | 2012 2013 2014 |
Lawrence Timmons Navorro Bowman Clay Matthews |
168.25 198.55 156.50 |
174.4 | Odell Thurman (191.03) |
| Ed McDaniel (169.68) Patrick Willis (159.28) Lavonte David (158.43) Brian Urlacher (148.85) |
|||||||
| 1.03 | $18, 4 years | 5 | 2012 2013 2014 |
Zach Brown Jerrell Freeman Connor Barwin |
165.10 185.05 155.25 |
168.5 | Odell Thurman (191.03) |
| Ed McDaniel (169.68) | |||||||
| Patrick Willis (159.28) Lavonte David (158.43) Brian Urlacher (148.85) Luke Kuechly (146.62) |
|||||||
| 1.04 | $17, 4 years | 6 | 2012 2013 2014 |
Demarcus Ware Alec Ogletree Jamie Collins |
164.75 173.55 155.25 |
164.5 | Odell Thurman (191.03) Ed McDaniel (169.68) |
| Patrick Willis (159.28) Lavonte David (158.43) Brian Urlacher (148.85) Luke Kuechly (146.62) |
|||||||
| 1.05 | $16, 4 years | 8 | 2012 2013 2014 |
Rob Ninkovich Daryl Smith Lavonte David |
155.50 165.10 146.50 |
155.7 | Odell Thurman (191.03) Ed McDaniel (169.68) Patrick Willis (159.28) |
| Lavonte David (158.43) | |||||||
| Brian Urlacher (148.85) Luke Kuechly (146.62) Jerrell Freeman (144.72) Von Miller (142.78) |
|||||||
| 1.06 | $15, 4 years | 11 | 2012 2013 2014 |
Justin Houston DeAndre Levy Junior Galette |
139.25 149.90 130.25 |
147.2 | Odell Thurman (191.03) Ed McDaniel (169.68) Patrick Willis (159.28) Lavonte David (158.43) |
| Brian Urlacher (148.85) Luke Kuechly (146.62) Jerrell Freeman (144.72) |
|||||||
| Von Miller (142.78) Ray Lewis (141.32) |
|||||||
| 1.07 1.08 1.09 |
$14, 4 years $13, 4 years $12, 4 years |
14 | 2012 2013 2014 |
Lance Briggs Danny Trevathan Terrell Suggs |
137.30 144.95 130.00 |
139.8 | Brian Urlacher (148.85) Luke Kuechly (146.62) Jerrell Freeman (144.72) Von Miller (142.78) |
| Ray Lewis (141.32) Ryan Kerrigan (138.07) |
|||||||
| Zach Thomas (134.11) Terrell Suggs (134.01) Jon Beason (132.95) |
|||||||
| 1.10 | $11, 4 years | 15 | 2012 2013 2014 |
Ryan Kerrigan Vontaze Burfict Luke Kuechly |
137.30 144.95 130.00 |
137.4 | Luke Kuechly (146.62) Jerrell Freeman (144.72) Von Miller (142.78) Ray Lewis (141.32) |
| Ryan Kerrigan (138.07) | |||||||
| Zach Thomas (134.11) Terrell Suggs (134.01) Jon Beason (132.95) Clay Matthews (130.59) |
|||||||
| 2.01 2.02 2.03 2.04 |
$10, 3-4 years $10, 3-4 years $10, 3-4 years $10, 3-4 year |
17 | 2012 2013 2014 |
Shaun Phillips Ryan Kerrigan Brandon Marshall |
136.50 143.75 121.00 |
133.8 | Von Miller (142.78) Ray Lewis (141.32) Ryan Kerrigan (138.07) |
| Zach Thomas (134.11) Terrell Suggs (134.01) Jon Beason (132.95) |
|||||||
| Clay Matthews (130.59) Justin Houston (130.22) Lofa Tatupu (130.15) |
|||||||
| 2.05 2.06 2.07 |
$9, 3-4 years $9, 3-4 years $9, 3-4 years |
19 | 2012 2013 2014 |
Rob Jackson Brian Orakpo Bruce Irvin |
132.65 136.65 116.40 |
128.6 | Terrell Suggs (134.01) Jon Beason (132.95) |
| Clay Matthews (130.59) Justin Houston (130.22) Lofa Tatupu (130.15) NaVorro Bowman (126.78) DeMeco Ryans (126.41) |
|||||||
| James Laurinaitis (125.24) Takeo Spikes (124.32) |
|||||||
| 2.08 2.09 |
$8, 3-4 years $8, 3-4 years |
21 | 2012 2013 2014 |
Derrick Johnson Derrick Johnson Danny Lansanah |
128.25 134.40 113.50 |
125.4 | Clay Matthews (130.59) Justin Houston (130.22) Lofa Tatupu (130.15) |
| NaVorro Bowman (126.78) DeMeco Ryans (126.41) James Laurinaitis (125.24) Takeo Spikes (124.32) Joey Porter (123.98) |
|||||||
| Kirk Morrison (122.53) | |||||||
| 2.10 | $7, 3-4 years | 22 | 2012 2013 2014 |
Luke Kuechly Trent Cole Jason Worilds |
127.50 133.50 113.00 |
124.7 | Justin Houston (130.22) Lofa Tatupu (130.15) |
| NaVorro Bowman (126.78) DeMeco Ryans (126.41) James Laurinaitis (125.24) Takeo Spikes (124.32) Joey Porter (123.98) Kirk Morrison (122.53) |
|||||||
| LaMarr Woodley (119.65) | |||||||
Let’s face it, you’d have to be a little nuts to blow a top 10 pick on a Linebacker, not that they’re not capable of delivering value for that, but they lack the upside of an offensive player. All of which said, a second round linebacker would be looking at producing a starter’s performance over 4 years, but as a 2nd or 3rd best on your team in that role, and unlike DTs there’s plenty of recent comparators to suggest there’s value to be had. With more teams transitioning to 3-4 defences, outside guys playing as pass rushing ends can represent good value with DE-type performance at an LB price and as with DEs, there’s enough in the comparative rookies to suggest that a good LB is a decent long-term option at the position who can produce for years. Unlike ends however there’s not really the late round breakout stars, if they’re not taken in the first two rounds of the NFL draft then they quickly drop into fantasy irrelevance.
Cornerbacks
| Pick | Contract | Rank | Actual Performers | Average | Comparisons | ||
| 1.01 1.02 1.03 1.04 1.05 |
$20, 4 years $19, 4 years $18, 4 years $17, 4 years $16, 4 years |
N/A | N/A | ||||
| 1.06 | $15, 4 years | 1 | 2012 2013 2014 |
Aqib Talib Brandon Boykin Charles Tillman |
234.60 159.48 140.45 |
178.2 | Richard Sherman (151.1) Nate Clements (141.34) Jairus Byrd (136.88) Charles Tillman (131.62) |
| 1.07 1.08 1.09 |
$14, 4 years $13, 4 years $12, 4 years |
2 | 2012 2013 2014 |
Richard Sherman Deangelo Hall Kyle Fuller |
204.20 157.65 132.35 |
164.7 | |
| 1.10 | $11, 4 years | 3 | 2012 2013 2014 |
Tim Jennings Richard Sherman Vontae Davis |
178.35 151.95 130.15 |
153.5 | Richard Sherman (151.1) |
| Nate Clements (141.34) Jairus Byrd (136.88) Charles Tillman (131.62) |
|||||||
| 2.01 2.02 2.03 2.04 |
$10, 3-4 years $10, 3-4 years $10, 3-4 years $10, 3-4 year |
4 | 2012 2013 2014 |
Patrick Peterson Alterrun Verner Brent Grimes |
159.85 142.28 128.00 |
143.4 | Richard Sherman (151.1) |
| Nate Clements (141.34) | |||||||
| Jairus Byrd (136.88) Charles Tillman (131.62) Leon Hall (131.62) |
|||||||
| 2.05 2.06 2.07 2.08 2.09 |
$9, 3-4 years $9, 3-4 years $9, 3-4 years $8, 3-4 years $8, 3-4 years |
6 | 2012 2013 2014 |
Janoris Jenkins Tramon Williams Joe Haden |
155.55 135.50 123.75 |
138.3 | Richard Sherman (151.1) Nate Clements (141.34) |
| Jairus Byrd (136.88) | |||||||
| Charles Tillman (131.62) Leon Hall (131.62) Rashean Mathis (131.58) |
|||||||
| 2.10 | $7, 3-4 years | 7 | 2012 2013 2014 |
Casey Hayward Captain Munnerlyn Jason McCourty |
142.85 130.85 123.50 |
132.4 | Richard Sherman (151.1) Nate Clements (141.34) Jairus Byrd (136.88) |
| Charles Tillman (131.62) Leon Hall (131.62) Rashean Mathis (131.58) |
|||||||
| Kyle Fuller (129.65) | |||||||
Well, this is painful. There’s no corner in the league on more than a top 5 pick, and you’re looking at any corner taken in the first two rounds being a bad value pick who’s going to have to immediately produce great numbers, and even at the end of the second round you’re looking at guys who’d be in the top 5 rookies of the last 20 years. One thing to note, as with the linebacker position, there’s a pretty clear drop in the performance of players picked after the first two rounds, and despite the well-known stories about Sherman and the Seahawks finding great backs cheap in the late rounds, this is the exception rather than the rule, and in the case of Sherman a significant exception at that.
Safeties
| Pick | Contract | Rank | Actual Performers | Average | Comparisons | ||
| 1.01 1.02 |
$20, 4 years $19, 4 years |
2 | 2012 2013 2014 |
Jairus Byrd Troy Polamalu James Ihedigbo |
155.35 161.35 150.10 |
155.6 | Ed Reed (156.29) |
| Keith Lyle (140.74) Roy Williams (139.51) Jairus Byrd (138.22) O.J. Atogwe (136.04) |
|||||||
| 1.03 | $18, 4 years | 3 | 2012 2013 2014 |
Reshad Jones Antrel Rolle Mike Adams |
144.35 160.80 140.90 |
148.7 | Ed Reed (156.29) |
| Keith Lyle (140.74) Roy Williams (139.51) Jairus Byrd (138.22) O.J. Atogwe (136.04) |
|||||||
| 1.04 1.05 1.06 1.07 |
$17, 4 years $16, 4 years $15, 4 years $14, 4 years |
4 | 2012 2013 2014 |
Eric Weddle Michael Mitchell Glover Quin |
139.60 141.55 139.70 |
140.3 | Ed Reed (156.29) |
| Keith Lyle (140.74) Roy Williams (139.51) Jairus Byrd (138.22) |
|||||||
| O.J. Atogwe (136.04) Rashean Mathis (133.06) |
|||||||
| 1.08 | $13, 4 years | 5 | 2012 2013 2014 |
LaRon Landry William Moore Rashead Johnson |
135.95 139.35 137.35 |
137.6 | Ed Reed (156.29) Keith Lyle (140.74) |
| Roy Williams (139.51) Jairus Byrd (138.22) O.J. Atogwe (136.04) |
|||||||
| Rashean Mathis (133.06) Willie Clay (130.58) Kerry Rhodes (127.78) |
|||||||
| 1.09 | $12, 4 years | 7 | 2012 2013 2014 |
Thomas DeCoud Earl Thomas Tashaun Gipson |
132.90 130.85 131.80 |
131.9 | Keith Lyle (140.74) Roy Williams (139.51) Jairus Byrd (138.22) O.J. Atogwe (136.04) |
| Rashean Mathis (133.06) Willie Clay (130.58) |
|||||||
| Kerry Rhodes (127.78) Greg Wesley (126.85) Devin McCourty (126.15) |
|||||||
| 1.10 | $11, 4 years | 8 | 2012 2013 2014 |
William Moore TJ Ward Charles Woodson |
131.35 126.95 124.90 |
127.7 | Jairus Byrd (138.22) O.J. Atogwe (136.04) Rashean Mathis (133.06) Willie Clay (130.58) |
| Kerry Rhodes (127.78) Greg Wesley (126.85) Devin McCourty (126.15) |
|||||||
| Michael Griffin (124.62) Sean Taylor (121.93) |
|||||||
| 2.01 2.02 2.03 2.04 |
$10, 3-4 years $10, 3-4 years $10, 3-4 years $10, 3-4 year |
10 | 2012 2013 2014 |
Danieal Manning James Ihedigbo Reggie Nelson |
124.35 123.15 120.90 |
122.8 | Willie Clay (130.58) Kerry Rhodes (127.78) Greg Wesley (126.85) Devin McCourty (126.15) |
| Michael Griffin (124.62) Sean Taylor (121.93) |
|||||||
| Harrison Smith (119.53) Victor Green (118.12) Kurt Schulz (117.64) |
|||||||
| 2.05 2.06 2.07 |
$9, 3-4 years $9, 3-4 years $9, 3-4 years |
11 | 2012 2013 2014 |
Morgan Burnett Charles Woodson Kemal Ishmael |
123.35 122.30 118.45 |
121.4 | Kerry Rhodes (127.78) Greg Wesley (126.85) Devin McCourty (126.15) Michael Griffin (124.62) |
| Sean Taylor (121.93) Harrison Smith (119.53) |
|||||||
| Victor Green (118.12) Kurt Schulz (117.64) Mike Brown (117.57) |
|||||||
| 2.08 2.09 |
$8, 3-4 years $8, 3-4 years |
12 | 2012 2013 2014 |
Major Wright Eric Weddle Ryan Mundy |
122.25 118.75 116.95 |
119.3 | Greg Wesley (126.85) Devin McCourty (126.15) Michael Griffin (124.62) Sean Taylor (121.93) |
| Harrison Smith (119.53) Victor Green (118.12) Kurt Schulz (117.64) Mike Brown (117.57) Earl Thomas (117.43) |
|||||||
| 2.10 | $7, 3-4 years | 13 | 2012 2013 2014 |
Michael Griffin Aaron Williams Kendrick Lewis |
122.15 115.80 116.20 |
118.1 | Devin McCourty (126.15) Michael Griffin (124.62) Sean Taylor (121.93) |
| Harrison Smith (119.53) Victor Green (118.12) Kurt Schulz (117.64) Mike Brown (117.57) Earl Thomas (117.43) Anthony Henry (115.88) |
|||||||
Given Manboob’s love of the high-price Safety, it’s not a surprise to see you could just about justify the top pick of the draft on one. That said, it would only be justified if you could pick Ed Reed, who might just be the best Safety in the history of the NFL. Even then, you’re talking about only just justifying the price tag. All of which said, by the end of the second round a safety is not a terrible pick. I personally wouldn’t – the opportunity to get a good DE or DT there is solid, and the spread of players at relatively makeable scores suggest that it wouldn’t be hard to find any Safety to fill a roster gap, but they’re not an unreliable pick and can score reasonably well from the early part of their careers, with less pressure to be a top guy straight away compared to the cornerback market. Of course, it’s entirely possible this is more a reflection of the insanity of the Dynabowl’s safety market, rather than a real value statement.
Ultimately, there’s no real evidence to suggest that selecting a defensive player in even the first round makes a good value pick, any player picked is going to need to justify not just a roster spot, but a regular starting spot in his first couple of years. But, by the middle of the second round, they’re definitely players to start thinking about and at positions like CB, S and Linebacker where the performance of high picks v lower ones suggests NFL teams are pretty handy at drafting players it’s possibly worth considering reaching and over-paying (as long as you aren’t in a terrible cap situation) simply because there’s such a strong correlation, compared to other positions, between draft pick and rookie success.
Scheduling and Relative Strength
Following on from league schedule chat, I got thinking about the level of luck involved in the schedule and what the chances were of teams getting different amount of wins, considering the number of points they scored each week. It’s important to understand, of course, that just because a team scored a lot of points, it doesn’t mean they could have been consistent winners. If they scored massive amounts in just 3 weeks and at or below average the rest of the season they could look like big time Charlies when actually they were … erm … small time Freddies? Also, some weeks the entire league scored highly so a high score is merely par (weeks 8, 10 and 13 all featured average team scores of 190+), while other weeks the points were low so a high score had the chance to dominate (week 2 had an average score of only 158.7).
The point is that it definitely matters when you score those points, as well as how many of them you score.
So given I have the full weekly scoring available I decided to run some scenarios. In fact, practically every scenario. Sort of. There are some weakness which I am going to acknowledge up front.
So what I did was rank everyone’s score from first to last in the league in each week. From this you can derive the chance of winning in any given week. If you top scored you had a 100% chance of winning. If you were the 5th top scorer you had a 55.55% chance of winning (you could beat 5 teams out of 9 – 5/9 = 55.55%) and thus a 44.44% chance of losing. And so on.
By multiplying your chance of winning in week 1 by your chance of winning in week 2 and so on we can work out the chance of you winning every single game. If we create a list of all possible scenarios (ie every combination of win or lose for every week of the season), we can then work out the likelihood of each scenario. Add up all the scenarios that result in 7 wins and you have the % chance of that outcome.
The caveats:
- In week 10 Dyna Hard and Kelkowski had the same score. They didn’t play each other so there was no tie, but this would add a tie into the possible outcomes. This would change the number of scenarios across a 13 week season from 8,192 to 1,594,323. To avoid doing this I have knocked Dyna Hard down by 0.05 points so there’s no tie that week. This means that I slightly under-estimate Dyna Hard’s position in the end results and slightly over-estimate Kelkowski’s, but the difference is minimal.
- I have not done this based on feasible schedules that fit with our ‘play your division twice, the other division once’ rules. This is purely done on the basis of how many teams could you beat each week. This means that while it may say a team has a small percentage chance of winning every week or losing every week, this may not actually be the case because that may rely on playing The Sadness or Kelkowski every week.
However, what this does do is provide an analysis of relative strength across the division as well as estimate the role schedule luck played in each team’s performance.
So first off I want to walk you through an example. East Flanders had a 0.13% chance of losing all 13 games in the season. The table below shows the ranking of each weekly points score for the team, the chance of losing in that individual week, and the cumulative chance of losing each week, one after the other:
| Score Rank | Chance of Losing | Cumulative Chance of Losing | |
| Week 1 | 6 | 55.56% | 55.56% |
| Week 2 | 4 | 33.33% | 18.52% |
| Week 3 | 10 | 100.00% | 18.52% |
| Week 4 | 8 | 77.78% | 14.40% |
| Week 5 | 8 | 77.78% | 11.20% |
| Week 6 | 7 | 66.67% | 7.47% |
| Week 7 | 10 | 100.00% | 7.47% |
| Week 8 | 8 | 77.78% | 5.81% |
| Week 9 | 9 | 88.89% | 5.16% |
| Week 10 | 7 | 66.67% | 3.44% |
| Week 11 | 8 | 77.78% | 2.68% |
| Week 12 | 2 | 11.11% | 0.30% |
| Week 13 | 5 | 44.44% | 0.13% |
A decent start and end to the season didn’t cover up a pretty terrible middle.
So doing this for every win/loss combination for every team gives the following table of likely win totals:
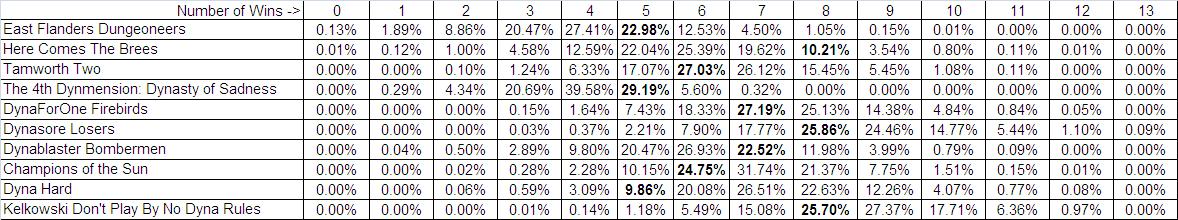
The figures highlighted in bold are the percentage chance the team had of recording the number of victories they actually did record. So Champions of the Sun ended up with 6 wins and there was a 24.75% chance of that happening based on their weekly scores (accepting the caveats listed earlier), while Dyna Hard had just a 9.86% likelihood of getting exactly 5 wins, as they managed across the year.
So for all bar two teams, the chances of ending with the record they ended with was between 22.52% and 29.19%, though only 3 teams ended with the record they were most likely to.
So the next stage is to look at the cumulative win chances – ie adding the percentage chances up as you move along. So each column in the table below shows the chances of winning between zero and n games (n being the number at the top of the column).
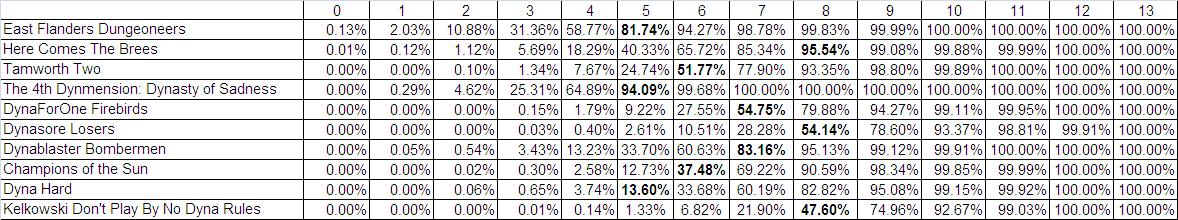
What this is saying is that the higher the cumulative number the luckier you would need to be to get that number of victories, while approximately 50% is where you would expect to be. So in 95.54% of scenarios Here Comes The Brees would win 8 or fewer games and only in 4.46% of scenarios would they win over 8 games. As we can see, there was only a 13.60% chance that Dyna Hard would win 5 or fewer games.
We can also reverse this and produce a table which shows the chances of reaching a minimum number of wins:
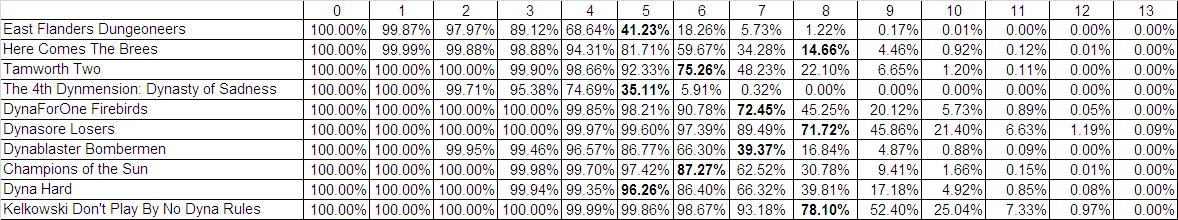
This shows that The Brees had only a 14.66% chance of getting at least the 8 wins they managed, while Dyna Hard were as close to guaranteed as you could reasonably expect to get to hit the 5 wins they did, with over a 96% chance of reaching that level. The Dynasty of Sadness were the second luckiest franchise, with only a 35% chance of getting 5 wins, although they had a better chance of getting 4 wins than East Flanders, while the Champions of the Sun were very lunlucky to register just 6 wins.
So what can we do with all this data? Well, we can use it to create an expected win number. By looking at where the 50% position falls in the above 2 cumulative tables and taking the average of the 2 positions we can see the expected number of wins for each team based on their performance.
| Team | Expected Wins | Exp. Win Rank | Actual Wins | Diff. | % Difference |
| Kelkowski Don’t Play By No Dyna Rules | 8.59 | 1 | 8 | -0.59 | -4.52% |
| Dynasore Losers | 8.34 | 2 | 8 | -0.34 | -2.61% |
| DynaForOne Firebirds | 7.33 | 3 | 7 | -0.33 | -2.50% |
| Dyna Hard | 7.12 | 4 | 5 | -2.12 | -16.27% |
| Champions of the Sun | 6.89 | 5 | 6 | -0.89 | -6.88% |
| Tamworth Two | 6.43 | 6 | 6 | -0.43 | -3.34% |
| Dynablaster Bombermen | 6.11 | 7 | 7 | 0.89 | 6.88% |
| Here Comes The Brees | 5.88 | 8 | 8 | 2.12 | 16.30% |
| East Flanders Dungeoneers | 4.18 | 9 | 5 | 0.82 | 6.31% |
| The 4th Dynmension: Dynasty of Sadness | 4.12 | 10 | 5 | 0.88 | 6.74% |
So most teams were within 1 win of where they would be expected to end up, but Dyna Hard and Here Come The Brees were both over 2 wins difference from what their week to week performance merited.
All told I am pleasantly surprised at how little difference the schedule made for most people. This may be a case of there being so few games it’s harder to separate from the mean, but then again, 20% of the league – a not insignificant proportion – were over 2 games different from their expected level.
What can be said at this point is that we don’t really know if this is a problem or not. Will there always be teams who get very lucky or unlucky or was 2014 an anomaly? Should we look to provide a degree of stabilisation to try to get the best performing teams over the course of the season into the playoffs? Or should we embrace randomness?
Kommish Komment Korner (again)
The fact that the match-ups, in a randomly assigned order, can make a large difference to the outcome of the season – something beyond the control of the GM – seems an unfair punishment (or reward) and if something can be done that removes an element of that, while maintaining the excitement of head-to-head match-ups, my view is it should be included.
What we have is not broken, but there are a few cracks in the facade and it would be nice to address those so that we have a league which is both fun and robust. The magic of the cup will remain, regardless, in the playoff stage. What the regular season should at least try to do is ensure that the best teams end up in the playoffs while the worst teams get the best picks in the draft in order to better themselves and make themselves more competitive. In 2014 the playoffs were 3/4 right in that regard, but it’s not as though the 4th part of that equation was a borderline case. Had Dyna Hard come 5th, just behind Champions of the Sun, the issue wouldn’t have been a talking point (and I realise I am the only one talking about it really so you may not consider it one anyway). But I think it is tough to argue that Dyna Hard merit the first pick of the draft ahead of DoS and East Flanders.
I’m not suggesting a revolution, I’m suggesting evolution. The league is one year old and we knew we wouldn’t get things right the first time. We need to adapt to make the league as good and as fair as possible. I don’t want playoffs to be decided based on all-play or total points or anything. We all put in a lot of time and effort and it is better that we have a system that rewards that time and effort and, where appropriate, skill as best as possible.
This won’t change for 2015 and the above analysis will be repeated after the 2015 season to see how different the league was from actual performance. There will then be a vote sometime in the new year about whether we should change the schedule and/or ranking system for teams. Cases will be made and, whatever the outcome, we will move forward, older and allegedly wiser.