Three visualisations to celebrate 10 years of the Dynabowl. These are mesmeric, and hopefully give everyone their moment in the sun. And shade.
The first, is the total number of all play wins growing over time.
Then the all-time cumulative win percentage, so rather than volumes pushing the bars along, it’s just shift in that winning percentage. I realise this may feel grim for some of you…
But here’s where everyone shines at some point – the rolling season long all-play winning percentage. It’s 16 weeks until the league expanded the regular season, at which point it extends to rolling-17 weeks, when we hit week 17 of the 2021 season. Does everybody hit the top? Check it out…
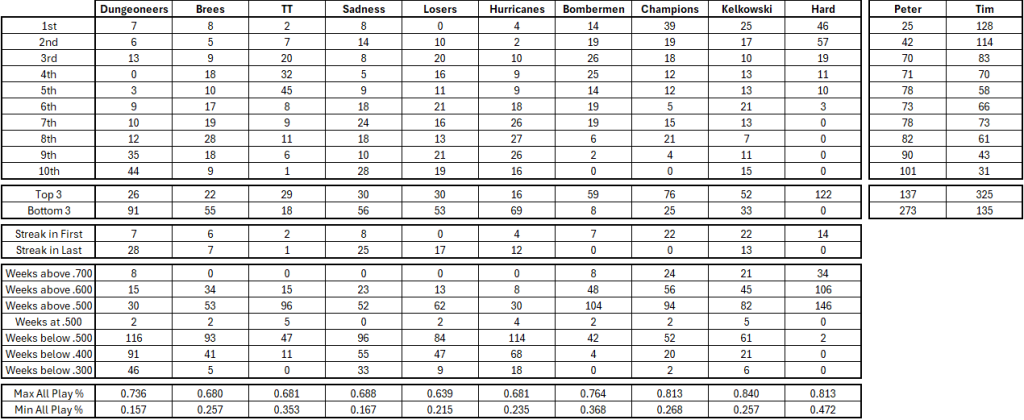
What’s that? You want to know how long each team has spent in each position in that rolling 16-season long all-play win percentage chart thingy above? Seems a little weird, but OK…

And who was the Rolling-Season Long Form Table leader at the end of each season, and what was their all-play winning percentage compared to the team that actually won the title.

Kelkowski’s title in 2016 was a travesty, everywhere else it’s been pretty close.